Yaqui vs Immigrants from Switzerland Male Unemployment
COMPARE
Yaqui
Immigrants from Switzerland
Male Unemployment
Male Unemployment Comparison
Yaqui
Immigrants from Switzerland
5.7%
MALE UNEMPLOYMENT
0.7/ 100
METRIC RATING
245th/ 347
METRIC RANK
5.2%
MALE UNEMPLOYMENT
79.2/ 100
METRIC RATING
141st/ 347
METRIC RANK
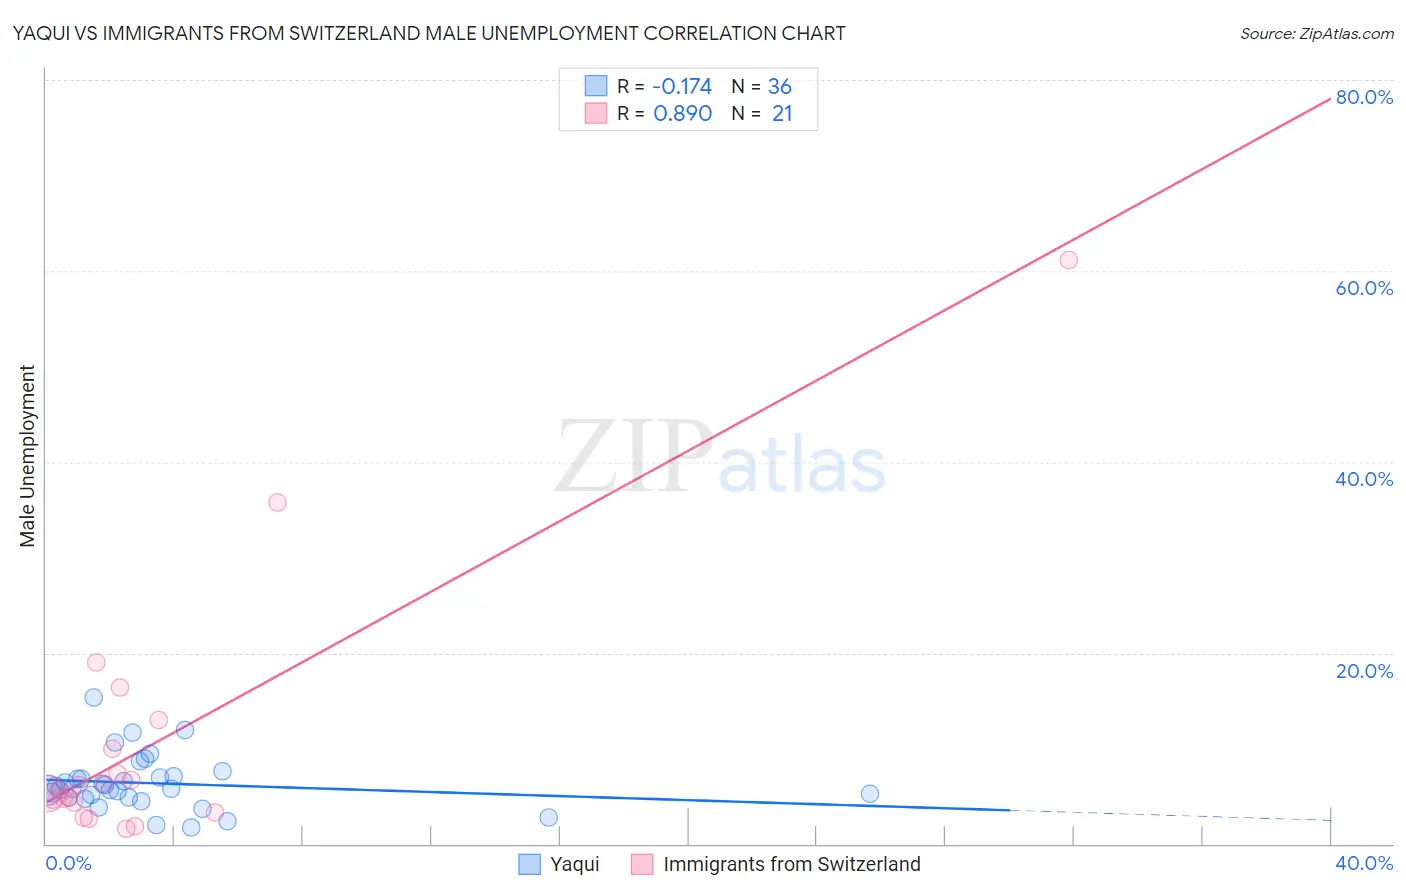
Yaqui vs Immigrants from Switzerland Male Unemployment Correlation Chart
The statistical analysis conducted on geographies consisting of 107,561,387 people shows a poor negative correlation between the proportion of Yaqui and unemployment rate among males in the United States with a correlation coefficient (R) of -0.174 and weighted average of 5.7%. Similarly, the statistical analysis conducted on geographies consisting of 147,847,273 people shows a very strong positive correlation between the proportion of Immigrants from Switzerland and unemployment rate among males in the United States with a correlation coefficient (R) of 0.890 and weighted average of 5.2%, a difference of 9.5%.
Male Unemployment Correlation Summary
| Measurement | Yaqui | Immigrants from Switzerland |
| Minimum | 1.7% | 1.6% |
| Maximum | 15.3% | 61.1% |
| Range | 13.6% | 59.5% |
| Mean | 6.3% | 10.6% |
| Median | 5.8% | 5.6% |
| Interquartile 25% (IQ1) | 4.8% | 3.8% |
| Interquartile 75% (IQ3) | 7.0% | 11.5% |
| Interquartile Range (IQR) | 2.1% | 7.7% |
| Standard Deviation (Sample) | 2.8% | 13.9% |
| Standard Deviation (Population) | 2.8% | 13.6% |
Similar Demographics by Male Unemployment
Demographics Similar to Yaqui by Male Unemployment
In terms of male unemployment, the demographic groups most similar to Yaqui are Iroquois (5.7%, a difference of 0.090%), Immigrants from El Salvador (5.7%, a difference of 0.17%), Hawaiian (5.7%, a difference of 0.19%), Bangladeshi (5.7%, a difference of 0.21%), and Ottawa (5.7%, a difference of 0.50%).
| Demographics | Rating | Rank | Male Unemployment |
| Native Hawaiians | 1.1 /100 | #238 | Tragic 5.6% |
| Immigrants | Guatemala | 1.1 /100 | #239 | Tragic 5.6% |
| Immigrants | Cameroon | 1.0 /100 | #240 | Tragic 5.6% |
| Salvadorans | 1.0 /100 | #241 | Tragic 5.7% |
| Ottawa | 0.9 /100 | #242 | Tragic 5.7% |
| Bangladeshis | 0.8 /100 | #243 | Tragic 5.7% |
| Immigrants | El Salvador | 0.7 /100 | #244 | Tragic 5.7% |
| Yaqui | 0.7 /100 | #245 | Tragic 5.7% |
| Iroquois | 0.6 /100 | #246 | Tragic 5.7% |
| Hawaiians | 0.6 /100 | #247 | Tragic 5.7% |
| Marshallese | 0.5 /100 | #248 | Tragic 5.7% |
| Cree | 0.4 /100 | #249 | Tragic 5.7% |
| Immigrants | Bahamas | 0.4 /100 | #250 | Tragic 5.7% |
| Spanish Americans | 0.3 /100 | #251 | Tragic 5.7% |
| Mexicans | 0.2 /100 | #252 | Tragic 5.8% |
Demographics Similar to Immigrants from Switzerland by Male Unemployment
In terms of male unemployment, the demographic groups most similar to Immigrants from Switzerland are Brazilian (5.2%, a difference of 0.010%), Kenyan (5.2%, a difference of 0.020%), Immigrants from Croatia (5.2%, a difference of 0.040%), Immigrants from Eastern Africa (5.2%, a difference of 0.050%), and Lebanese (5.2%, a difference of 0.060%).
| Demographics | Rating | Rank | Male Unemployment |
| Pakistanis | 80.5 /100 | #134 | Excellent 5.2% |
| Immigrants | Saudi Arabia | 80.1 /100 | #135 | Excellent 5.2% |
| Lebanese | 79.9 /100 | #136 | Good 5.2% |
| Immigrants | Eastern Africa | 79.8 /100 | #137 | Good 5.2% |
| Immigrants | Croatia | 79.7 /100 | #138 | Good 5.2% |
| Kenyans | 79.4 /100 | #139 | Good 5.2% |
| Brazilians | 79.3 /100 | #140 | Good 5.2% |
| Immigrants | Switzerland | 79.2 /100 | #141 | Good 5.2% |
| Fijians | 78.3 /100 | #142 | Good 5.2% |
| Syrians | 78.0 /100 | #143 | Good 5.2% |
| Sri Lankans | 77.9 /100 | #144 | Good 5.2% |
| Macedonians | 77.7 /100 | #145 | Good 5.2% |
| Immigrants | Kenya | 77.6 /100 | #146 | Good 5.2% |
| Immigrants | Burma/Myanmar | 77.5 /100 | #147 | Good 5.2% |
| Immigrants | Italy | 76.3 /100 | #148 | Good 5.2% |