Delaware vs Immigrants from Haiti Unemployment Among Women with Children Under 6 years
COMPARE
Delaware
Immigrants from Haiti
Unemployment Among Women with Children Under 6 years
Unemployment Among Women with Children Under 6 years Comparison
Delaware
Immigrants from Haiti
9.8%
UNEMPLOYMENT AMONG WOMEN WITH CHILDREN UNDER 6 YEARS
0.0/ 100
METRIC RATING
326th/ 347
METRIC RANK
8.4%
UNEMPLOYMENT AMONG WOMEN WITH CHILDREN UNDER 6 YEARS
0.2/ 100
METRIC RATING
269th/ 347
METRIC RANK
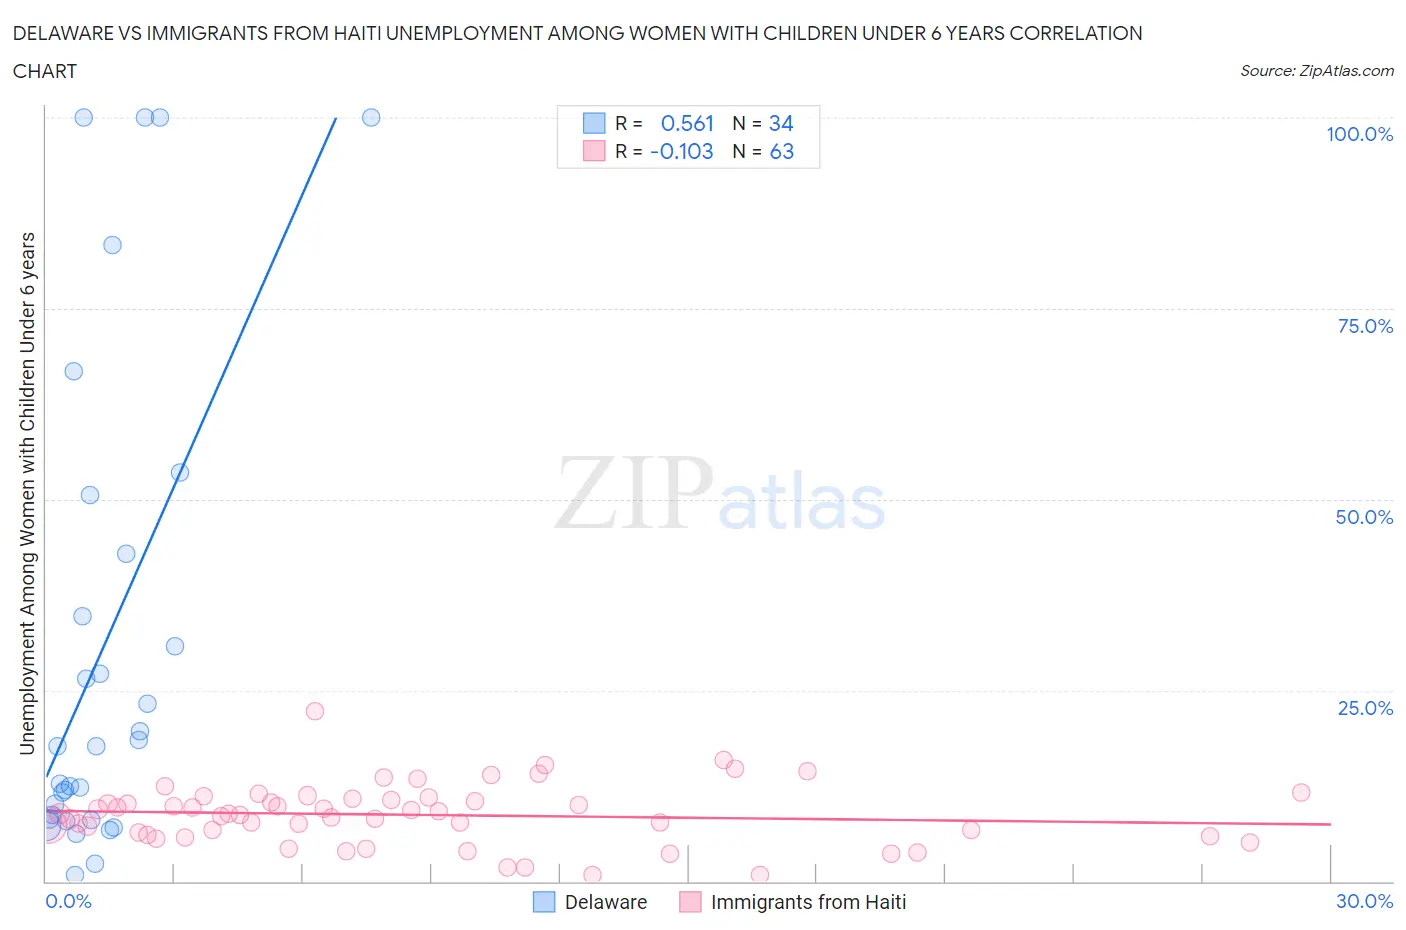
Delaware vs Immigrants from Haiti Unemployment Among Women with Children Under 6 years Correlation Chart
The statistical analysis conducted on geographies consisting of 85,487,463 people shows a substantial positive correlation between the proportion of Delaware and unemployment rate among women with children under the age of 6 in the United States with a correlation coefficient (R) of 0.561 and weighted average of 9.8%. Similarly, the statistical analysis conducted on geographies consisting of 184,706,407 people shows a poor negative correlation between the proportion of Immigrants from Haiti and unemployment rate among women with children under the age of 6 in the United States with a correlation coefficient (R) of -0.103 and weighted average of 8.4%, a difference of 16.1%.
Unemployment Among Women with Children Under 6 years Correlation Summary
| Measurement | Delaware | Immigrants from Haiti |
| Minimum | 0.90% | 0.80% |
| Maximum | 100.0% | 22.2% |
| Range | 99.1% | 21.4% |
| Mean | 30.8% | 8.7% |
| Median | 17.7% | 8.8% |
| Interquartile 25% (IQ1) | 8.2% | 6.1% |
| Interquartile 75% (IQ3) | 42.9% | 10.8% |
| Interquartile Range (IQR) | 34.7% | 4.7% |
| Standard Deviation (Sample) | 31.7% | 4.0% |
| Standard Deviation (Population) | 31.2% | 3.9% |
Similar Demographics by Unemployment Among Women with Children Under 6 years
Demographics Similar to Delaware by Unemployment Among Women with Children Under 6 years
In terms of unemployment among women with children under 6 years, the demographic groups most similar to Delaware are Choctaw (9.8%, a difference of 0.030%), Ottawa (9.9%, a difference of 0.80%), Paiute (9.7%, a difference of 0.98%), Immigrants from Bahamas (9.6%, a difference of 1.7%), and Alaska Native (9.6%, a difference of 1.9%).
| Demographics | Rating | Rank | Unemployment Among Women with Children Under 6 years |
| Marshallese | 0.0 /100 | #319 | Tragic 9.6% |
| Potawatomi | 0.0 /100 | #320 | Tragic 9.6% |
| Central American Indians | 0.0 /100 | #321 | Tragic 9.6% |
| Alaska Natives | 0.0 /100 | #322 | Tragic 9.6% |
| Immigrants | Bahamas | 0.0 /100 | #323 | Tragic 9.6% |
| Paiute | 0.0 /100 | #324 | Tragic 9.7% |
| Choctaw | 0.0 /100 | #325 | Tragic 9.8% |
| Delaware | 0.0 /100 | #326 | Tragic 9.8% |
| Ottawa | 0.0 /100 | #327 | Tragic 9.9% |
| Tohono O'odham | 0.0 /100 | #328 | Tragic 10.2% |
| Blacks/African Americans | 0.0 /100 | #329 | Tragic 10.3% |
| Pennsylvania Germans | 0.0 /100 | #330 | Tragic 10.8% |
| Colville | 0.0 /100 | #331 | Tragic 11.2% |
| Sioux | 0.0 /100 | #332 | Tragic 11.5% |
| Natives/Alaskans | 0.0 /100 | #333 | Tragic 11.5% |
Demographics Similar to Immigrants from Haiti by Unemployment Among Women with Children Under 6 years
In terms of unemployment among women with children under 6 years, the demographic groups most similar to Immigrants from Haiti are Subsaharan African (8.4%, a difference of 0.090%), Belizean (8.4%, a difference of 0.19%), Immigrants from Senegal (8.5%, a difference of 0.34%), Immigrants from Congo (8.5%, a difference of 0.35%), and Immigrants from Honduras (8.4%, a difference of 0.45%).
| Demographics | Rating | Rank | Unemployment Among Women with Children Under 6 years |
| West Indians | 0.3 /100 | #262 | Tragic 8.4% |
| Scotch-Irish | 0.3 /100 | #263 | Tragic 8.4% |
| Hondurans | 0.3 /100 | #264 | Tragic 8.4% |
| French Canadians | 0.3 /100 | #265 | Tragic 8.4% |
| Immigrants | Honduras | 0.3 /100 | #266 | Tragic 8.4% |
| Belizeans | 0.2 /100 | #267 | Tragic 8.4% |
| Sub-Saharan Africans | 0.2 /100 | #268 | Tragic 8.4% |
| Immigrants | Haiti | 0.2 /100 | #269 | Tragic 8.4% |
| Immigrants | Senegal | 0.2 /100 | #270 | Tragic 8.5% |
| Immigrants | Congo | 0.2 /100 | #271 | Tragic 8.5% |
| Mexican American Indians | 0.1 /100 | #272 | Tragic 8.5% |
| Slovaks | 0.1 /100 | #273 | Tragic 8.5% |
| Immigrants | Cameroon | 0.1 /100 | #274 | Tragic 8.6% |
| Immigrants | Latin America | 0.1 /100 | #275 | Tragic 8.6% |
| Yaqui | 0.0 /100 | #276 | Tragic 8.6% |