Iranian vs Liberian Unemployment Among Women with Children Under 6 years
COMPARE
Iranian
Liberian
Unemployment Among Women with Children Under 6 years
Unemployment Among Women with Children Under 6 years Comparison
Iranians
Liberians
6.7%
UNEMPLOYMENT AMONG WOMEN WITH CHILDREN UNDER 6 YEARS
99.9/ 100
METRIC RATING
44th/ 347
METRIC RANK
8.1%
UNEMPLOYMENT AMONG WOMEN WITH CHILDREN UNDER 6 YEARS
2.6/ 100
METRIC RATING
241st/ 347
METRIC RANK
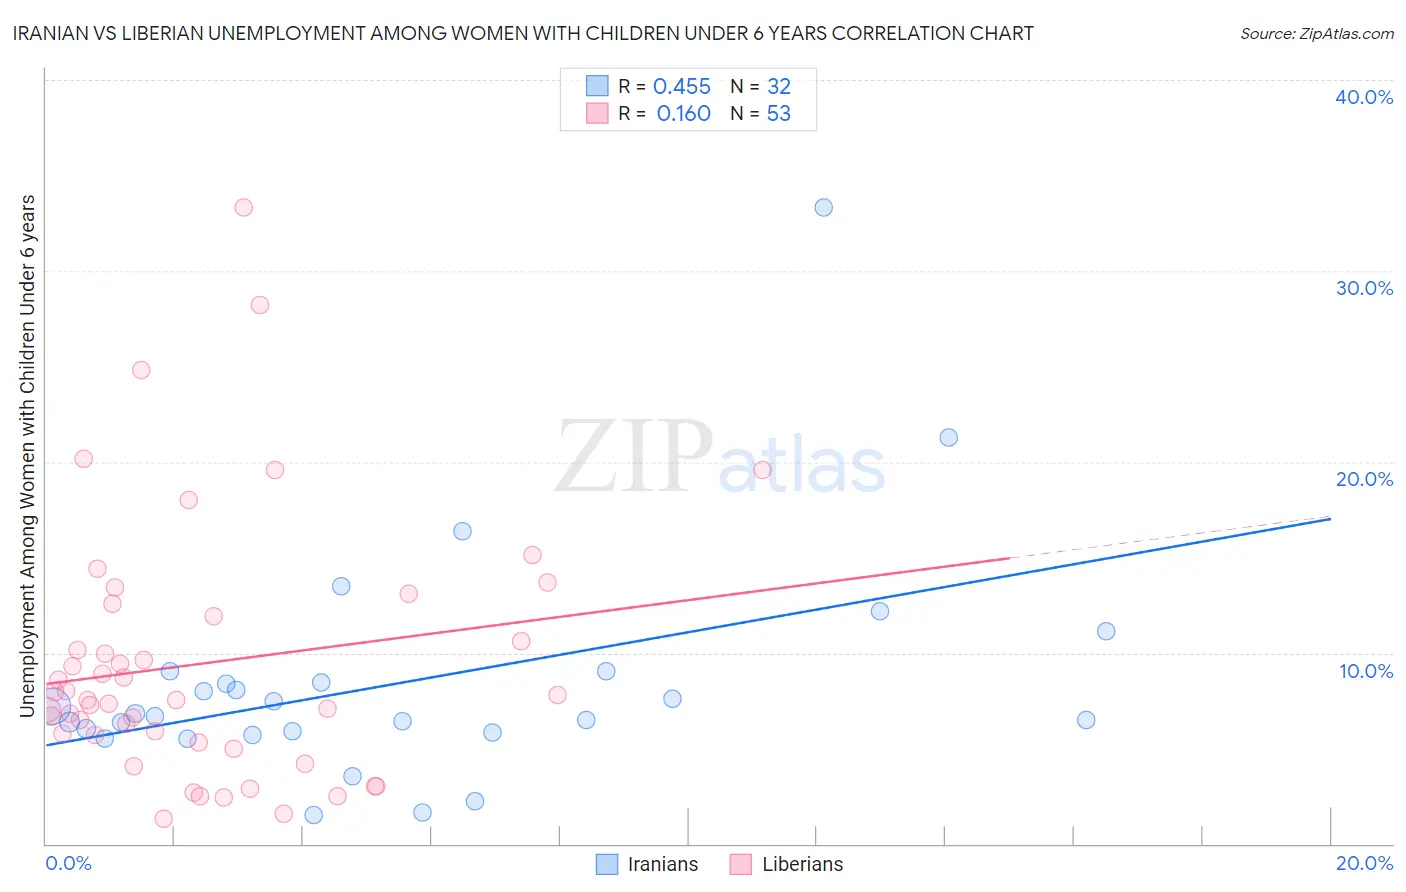
Iranian vs Liberian Unemployment Among Women with Children Under 6 years Correlation Chart
The statistical analysis conducted on geographies consisting of 253,710,938 people shows a moderate positive correlation between the proportion of Iranians and unemployment rate among women with children under the age of 6 in the United States with a correlation coefficient (R) of 0.455 and weighted average of 6.7%. Similarly, the statistical analysis conducted on geographies consisting of 106,761,438 people shows a poor positive correlation between the proportion of Liberians and unemployment rate among women with children under the age of 6 in the United States with a correlation coefficient (R) of 0.160 and weighted average of 8.1%, a difference of 20.1%.
Unemployment Among Women with Children Under 6 years Correlation Summary
| Measurement | Iranian | Liberian |
| Minimum | 1.5% | 1.3% |
| Maximum | 33.3% | 33.3% |
| Range | 31.8% | 32.0% |
| Mean | 8.4% | 9.5% |
| Median | 6.7% | 7.5% |
| Interquartile 25% (IQ1) | 5.8% | 5.5% |
| Interquartile 75% (IQ3) | 8.7% | 12.2% |
| Interquartile Range (IQR) | 2.9% | 6.7% |
| Standard Deviation (Sample) | 6.0% | 6.7% |
| Standard Deviation (Population) | 5.9% | 6.6% |
Similar Demographics by Unemployment Among Women with Children Under 6 years
Demographics Similar to Iranians by Unemployment Among Women with Children Under 6 years
In terms of unemployment among women with children under 6 years, the demographic groups most similar to Iranians are Immigrants from Australia (6.8%, a difference of 0.060%), Latvian (6.8%, a difference of 0.30%), Immigrants from Asia (6.8%, a difference of 0.47%), Immigrants from Switzerland (6.8%, a difference of 0.50%), and Bhutanese (6.7%, a difference of 0.55%).
| Demographics | Rating | Rank | Unemployment Among Women with Children Under 6 years |
| Sri Lankans | 100.0 /100 | #37 | Exceptional 6.6% |
| Hmong | 100.0 /100 | #38 | Exceptional 6.7% |
| Immigrants | Russia | 100.0 /100 | #39 | Exceptional 6.7% |
| Asians | 100.0 /100 | #40 | Exceptional 6.7% |
| Immigrants | Indonesia | 99.9 /100 | #41 | Exceptional 6.7% |
| Immigrants | Cuba | 99.9 /100 | #42 | Exceptional 6.7% |
| Bhutanese | 99.9 /100 | #43 | Exceptional 6.7% |
| Iranians | 99.9 /100 | #44 | Exceptional 6.7% |
| Immigrants | Australia | 99.9 /100 | #45 | Exceptional 6.8% |
| Latvians | 99.9 /100 | #46 | Exceptional 6.8% |
| Immigrants | Asia | 99.9 /100 | #47 | Exceptional 6.8% |
| Immigrants | Switzerland | 99.9 /100 | #48 | Exceptional 6.8% |
| Immigrants | Nepal | 99.9 /100 | #49 | Exceptional 6.8% |
| Immigrants | Ireland | 99.9 /100 | #50 | Exceptional 6.8% |
| Ethiopians | 99.9 /100 | #51 | Exceptional 6.8% |
Demographics Similar to Liberians by Unemployment Among Women with Children Under 6 years
In terms of unemployment among women with children under 6 years, the demographic groups most similar to Liberians are Immigrants from El Salvador (8.1%, a difference of 0.030%), Dutch (8.1%, a difference of 0.060%), Irish (8.1%, a difference of 0.10%), Immigrants from Middle Africa (8.1%, a difference of 0.36%), and Hawaiian (8.2%, a difference of 0.61%).
| Demographics | Rating | Rank | Unemployment Among Women with Children Under 6 years |
| Kiowa | 4.4 /100 | #234 | Tragic 8.0% |
| Comanche | 4.3 /100 | #235 | Tragic 8.0% |
| Immigrants | Barbados | 4.2 /100 | #236 | Tragic 8.0% |
| Immigrants | Costa Rica | 4.1 /100 | #237 | Tragic 8.0% |
| Immigrants | Middle Africa | 3.2 /100 | #238 | Tragic 8.1% |
| Irish | 2.7 /100 | #239 | Tragic 8.1% |
| Immigrants | El Salvador | 2.6 /100 | #240 | Tragic 8.1% |
| Liberians | 2.6 /100 | #241 | Tragic 8.1% |
| Dutch | 2.5 /100 | #242 | Tragic 8.1% |
| Hawaiians | 1.8 /100 | #243 | Tragic 8.2% |
| French | 1.7 /100 | #244 | Tragic 8.2% |
| Native Hawaiians | 1.7 /100 | #245 | Tragic 8.2% |
| Central Americans | 1.4 /100 | #246 | Tragic 8.2% |
| German Russians | 1.2 /100 | #247 | Tragic 8.2% |
| Immigrants | Western Africa | 1.1 /100 | #248 | Tragic 8.2% |