Immigrants from Sierra Leone vs Immigrants from Haiti Unemployment Among Women with Children Under 6 years
COMPARE
Immigrants from Sierra Leone
Immigrants from Haiti
Unemployment Among Women with Children Under 6 years
Unemployment Among Women with Children Under 6 years Comparison
Immigrants from Sierra Leone
Immigrants from Haiti
8.2%
UNEMPLOYMENT AMONG WOMEN WITH CHILDREN UNDER 6 YEARS
1.1/ 100
METRIC RATING
249th/ 347
METRIC RANK
8.4%
UNEMPLOYMENT AMONG WOMEN WITH CHILDREN UNDER 6 YEARS
0.2/ 100
METRIC RATING
269th/ 347
METRIC RANK
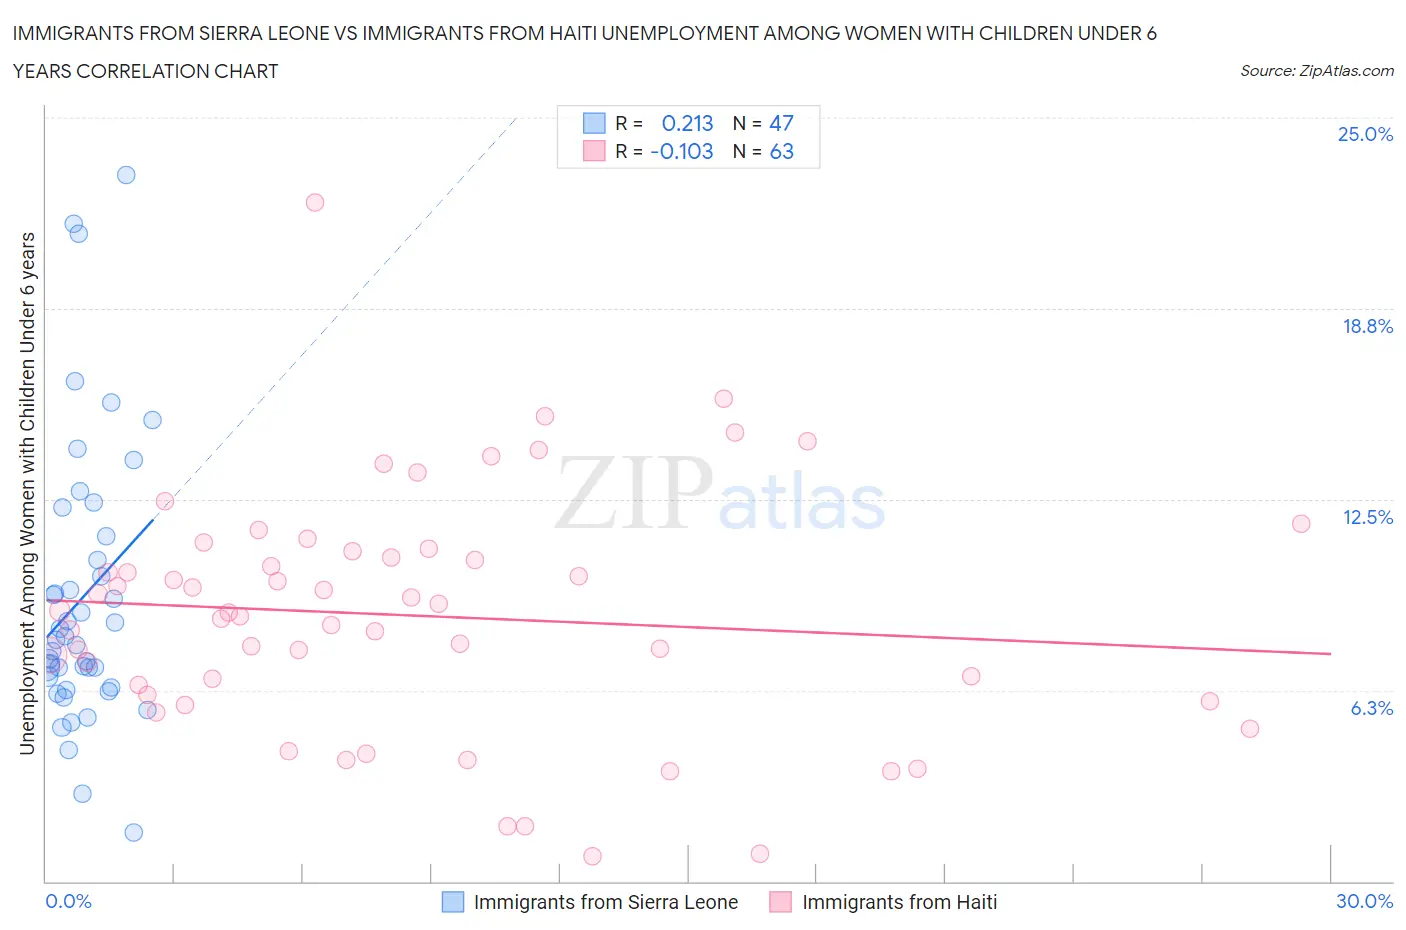
Immigrants from Sierra Leone vs Immigrants from Haiti Unemployment Among Women with Children Under 6 years Correlation Chart
The statistical analysis conducted on geographies consisting of 92,718,305 people shows a weak positive correlation between the proportion of Immigrants from Sierra Leone and unemployment rate among women with children under the age of 6 in the United States with a correlation coefficient (R) of 0.213 and weighted average of 8.2%. Similarly, the statistical analysis conducted on geographies consisting of 184,706,407 people shows a poor negative correlation between the proportion of Immigrants from Haiti and unemployment rate among women with children under the age of 6 in the United States with a correlation coefficient (R) of -0.103 and weighted average of 8.4%, a difference of 2.6%.
Unemployment Among Women with Children Under 6 years Correlation Summary
| Measurement | Immigrants from Sierra Leone | Immigrants from Haiti |
| Minimum | 1.6% | 0.80% |
| Maximum | 23.1% | 22.2% |
| Range | 21.5% | 21.4% |
| Mean | 9.3% | 8.7% |
| Median | 7.9% | 8.8% |
| Interquartile 25% (IQ1) | 6.3% | 6.1% |
| Interquartile 75% (IQ3) | 11.3% | 10.8% |
| Interquartile Range (IQR) | 5.0% | 4.7% |
| Standard Deviation (Sample) | 4.6% | 4.0% |
| Standard Deviation (Population) | 4.6% | 3.9% |
Demographics Similar to Immigrants from Sierra Leone and Immigrants from Haiti by Unemployment Among Women with Children Under 6 years
In terms of unemployment among women with children under 6 years, the demographic groups most similar to Immigrants from Sierra Leone are Nigerian (8.2%, a difference of 0.010%), Guyanese (8.2%, a difference of 0.18%), Ghanaian (8.2%, a difference of 0.18%), Immigrants from Guyana (8.2%, a difference of 0.36%), and Immigrants from Caribbean (8.3%, a difference of 0.63%). Similarly, the demographic groups most similar to Immigrants from Haiti are Subsaharan African (8.4%, a difference of 0.090%), Belizean (8.4%, a difference of 0.19%), Immigrants from Honduras (8.4%, a difference of 0.45%), French Canadian (8.4%, a difference of 0.46%), and Honduran (8.4%, a difference of 0.51%).
| Demographics | Rating | Rank | Unemployment Among Women with Children Under 6 years |
| Immigrants | Sierra Leone | 1.1 /100 | #249 | Tragic 8.2% |
| Nigerians | 1.1 /100 | #250 | Tragic 8.2% |
| Guyanese | 1.0 /100 | #251 | Tragic 8.2% |
| Ghanaians | 1.0 /100 | #252 | Tragic 8.2% |
| Immigrants | Guyana | 0.8 /100 | #253 | Tragic 8.2% |
| Immigrants | Caribbean | 0.7 /100 | #254 | Tragic 8.3% |
| Immigrants | Portugal | 0.6 /100 | #255 | Tragic 8.3% |
| Celtics | 0.6 /100 | #256 | Tragic 8.3% |
| British West Indians | 0.5 /100 | #257 | Tragic 8.3% |
| Immigrants | Ghana | 0.5 /100 | #258 | Tragic 8.3% |
| Barbadians | 0.4 /100 | #259 | Tragic 8.3% |
| Whites/Caucasians | 0.3 /100 | #260 | Tragic 8.4% |
| Immigrants | Liberia | 0.3 /100 | #261 | Tragic 8.4% |
| West Indians | 0.3 /100 | #262 | Tragic 8.4% |
| Scotch-Irish | 0.3 /100 | #263 | Tragic 8.4% |
| Hondurans | 0.3 /100 | #264 | Tragic 8.4% |
| French Canadians | 0.3 /100 | #265 | Tragic 8.4% |
| Immigrants | Honduras | 0.3 /100 | #266 | Tragic 8.4% |
| Belizeans | 0.2 /100 | #267 | Tragic 8.4% |
| Sub-Saharan Africans | 0.2 /100 | #268 | Tragic 8.4% |
| Immigrants | Haiti | 0.2 /100 | #269 | Tragic 8.4% |