Immigrants from Guyana vs Colville Unemployment Among Ages 45 to 54 years
COMPARE
Immigrants from Guyana
Colville
Unemployment Among Ages 45 to 54 years
Unemployment Among Ages 45 to 54 years Comparison
Immigrants from Guyana
Colville
5.6%
UNEMPLOYMENT AMONG AGES 45 TO 54 YEARS
0.0/ 100
METRIC RATING
316th/ 347
METRIC RANK
7.4%
UNEMPLOYMENT AMONG AGES 45 TO 54 YEARS
0.0/ 100
METRIC RATING
338th/ 347
METRIC RANK
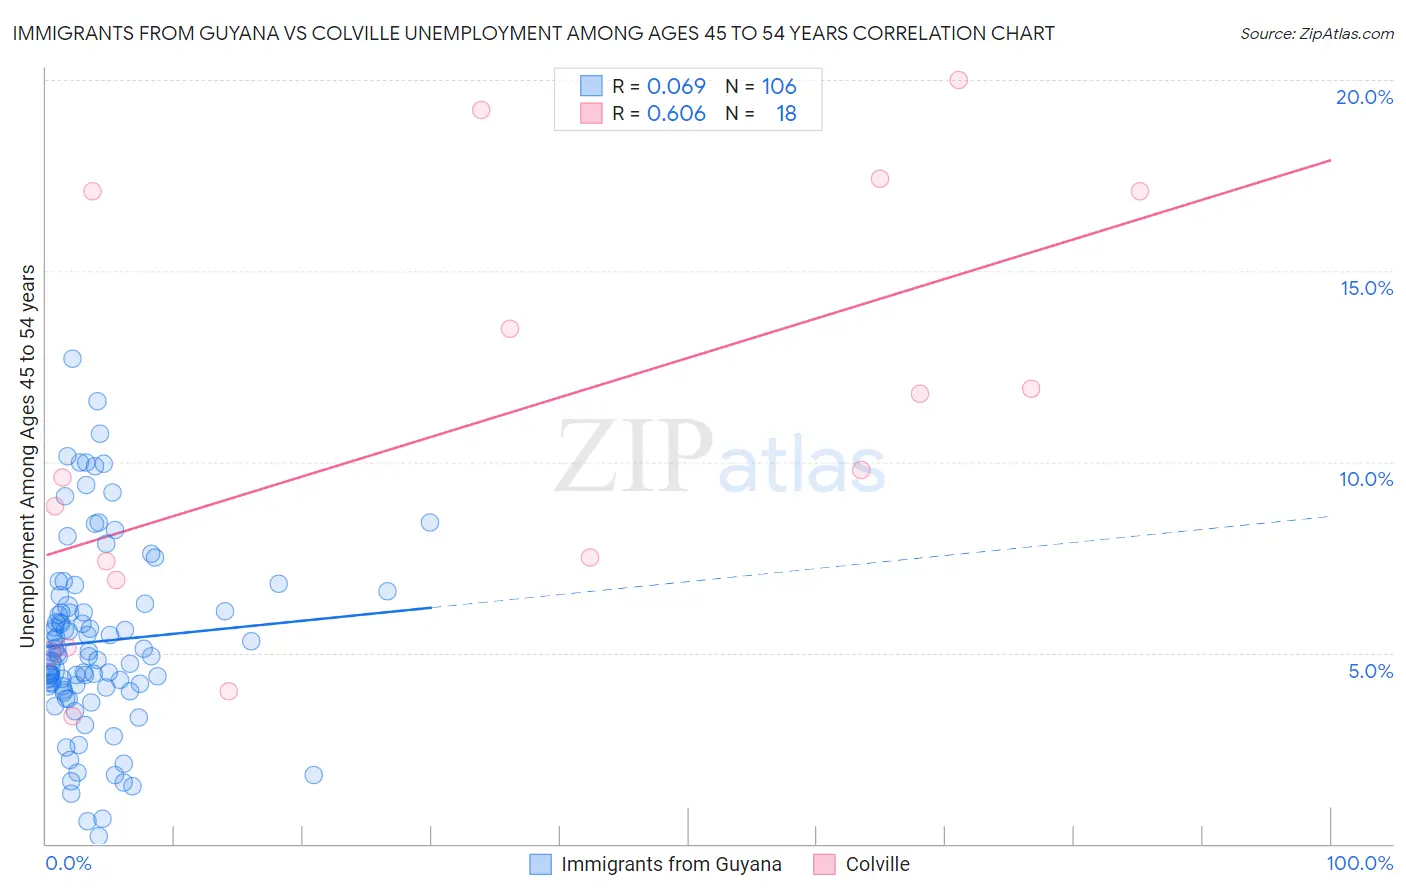
Immigrants from Guyana vs Colville Unemployment Among Ages 45 to 54 years Correlation Chart
The statistical analysis conducted on geographies consisting of 181,592,956 people shows a slight positive correlation between the proportion of Immigrants from Guyana and unemployment rate among population between the ages 45 and 54 in the United States with a correlation coefficient (R) of 0.069 and weighted average of 5.6%. Similarly, the statistical analysis conducted on geographies consisting of 34,483,294 people shows a significant positive correlation between the proportion of Colville and unemployment rate among population between the ages 45 and 54 in the United States with a correlation coefficient (R) of 0.606 and weighted average of 7.4%, a difference of 31.0%.
Unemployment Among Ages 45 to 54 years Correlation Summary
| Measurement | Immigrants from Guyana | Colville |
| Minimum | 0.20% | 3.3% |
| Maximum | 12.7% | 20.0% |
| Range | 12.5% | 16.7% |
| Mean | 5.3% | 10.9% |
| Median | 5.0% | 9.7% |
| Interquartile 25% (IQ1) | 4.1% | 6.9% |
| Interquartile 75% (IQ3) | 6.2% | 17.1% |
| Interquartile Range (IQR) | 2.1% | 10.2% |
| Standard Deviation (Sample) | 2.4% | 5.4% |
| Standard Deviation (Population) | 2.4% | 5.3% |
Similar Demographics by Unemployment Among Ages 45 to 54 years
Demographics Similar to Immigrants from Guyana by Unemployment Among Ages 45 to 54 years
In terms of unemployment among ages 45 to 54 years, the demographic groups most similar to Immigrants from Guyana are Houma (5.6%, a difference of 0.10%), Immigrants from Dominica (5.6%, a difference of 0.20%), Guyanese (5.6%, a difference of 0.38%), Shoshone (5.6%, a difference of 0.71%), and British West Indian (5.7%, a difference of 0.72%).
| Demographics | Rating | Rank | Unemployment Among Ages 45 to 54 years |
| Barbadians | 0.0 /100 | #309 | Tragic 5.5% |
| Immigrants | Barbados | 0.0 /100 | #310 | Tragic 5.5% |
| Chippewa | 0.0 /100 | #311 | Tragic 5.5% |
| Immigrants | Grenada | 0.0 /100 | #312 | Tragic 5.6% |
| Shoshone | 0.0 /100 | #313 | Tragic 5.6% |
| Guyanese | 0.0 /100 | #314 | Tragic 5.6% |
| Immigrants | Dominica | 0.0 /100 | #315 | Tragic 5.6% |
| Immigrants | Guyana | 0.0 /100 | #316 | Tragic 5.6% |
| Houma | 0.0 /100 | #317 | Tragic 5.6% |
| British West Indians | 0.0 /100 | #318 | Tragic 5.7% |
| Cape Verdeans | 0.0 /100 | #319 | Tragic 5.7% |
| Immigrants | St. Vincent and the Grenadines | 0.0 /100 | #320 | Tragic 5.7% |
| Yakama | 0.0 /100 | #321 | Tragic 5.7% |
| Immigrants | Azores | 0.0 /100 | #322 | Tragic 5.7% |
| Immigrants | Cabo Verde | 0.0 /100 | #323 | Tragic 5.9% |
Demographics Similar to Colville by Unemployment Among Ages 45 to 54 years
In terms of unemployment among ages 45 to 54 years, the demographic groups most similar to Colville are Arapaho (7.5%, a difference of 1.5%), Hopi (7.5%, a difference of 1.9%), Apache (7.0%, a difference of 5.0%), Paiute (7.8%, a difference of 5.5%), and Puerto Rican (6.8%, a difference of 8.5%).
| Demographics | Rating | Rank | Unemployment Among Ages 45 to 54 years |
| Tohono O'odham | 0.0 /100 | #331 | Tragic 6.3% |
| Pima | 0.0 /100 | #332 | Tragic 6.4% |
| Immigrants | Yemen | 0.0 /100 | #333 | Tragic 6.5% |
| Sioux | 0.0 /100 | #334 | Tragic 6.6% |
| Navajo | 0.0 /100 | #335 | Tragic 6.7% |
| Puerto Ricans | 0.0 /100 | #336 | Tragic 6.8% |
| Apache | 0.0 /100 | #337 | Tragic 7.0% |
| Colville | 0.0 /100 | #338 | Tragic 7.4% |
| Arapaho | 0.0 /100 | #339 | Tragic 7.5% |
| Hopi | 0.0 /100 | #340 | Tragic 7.5% |
| Paiute | 0.0 /100 | #341 | Tragic 7.8% |
| Alaskan Athabascans | 0.0 /100 | #342 | Tragic 8.5% |
| Inupiat | 0.0 /100 | #343 | Tragic 9.2% |
| Yuman | 0.0 /100 | #344 | Tragic 9.5% |
| Cheyenne | 0.0 /100 | #345 | Tragic 10.6% |