Immigrants vs Romanian Male Unemployment
COMPARE
Immigrants
Romanian
Male Unemployment
Male Unemployment Comparison
Immigrants
Romanians
5.5%
MALE UNEMPLOYMENT
4.3/ 100
METRIC RATING
216th/ 347
METRIC RANK
5.1%
MALE UNEMPLOYMENT
89.8/ 100
METRIC RATING
114th/ 347
METRIC RANK
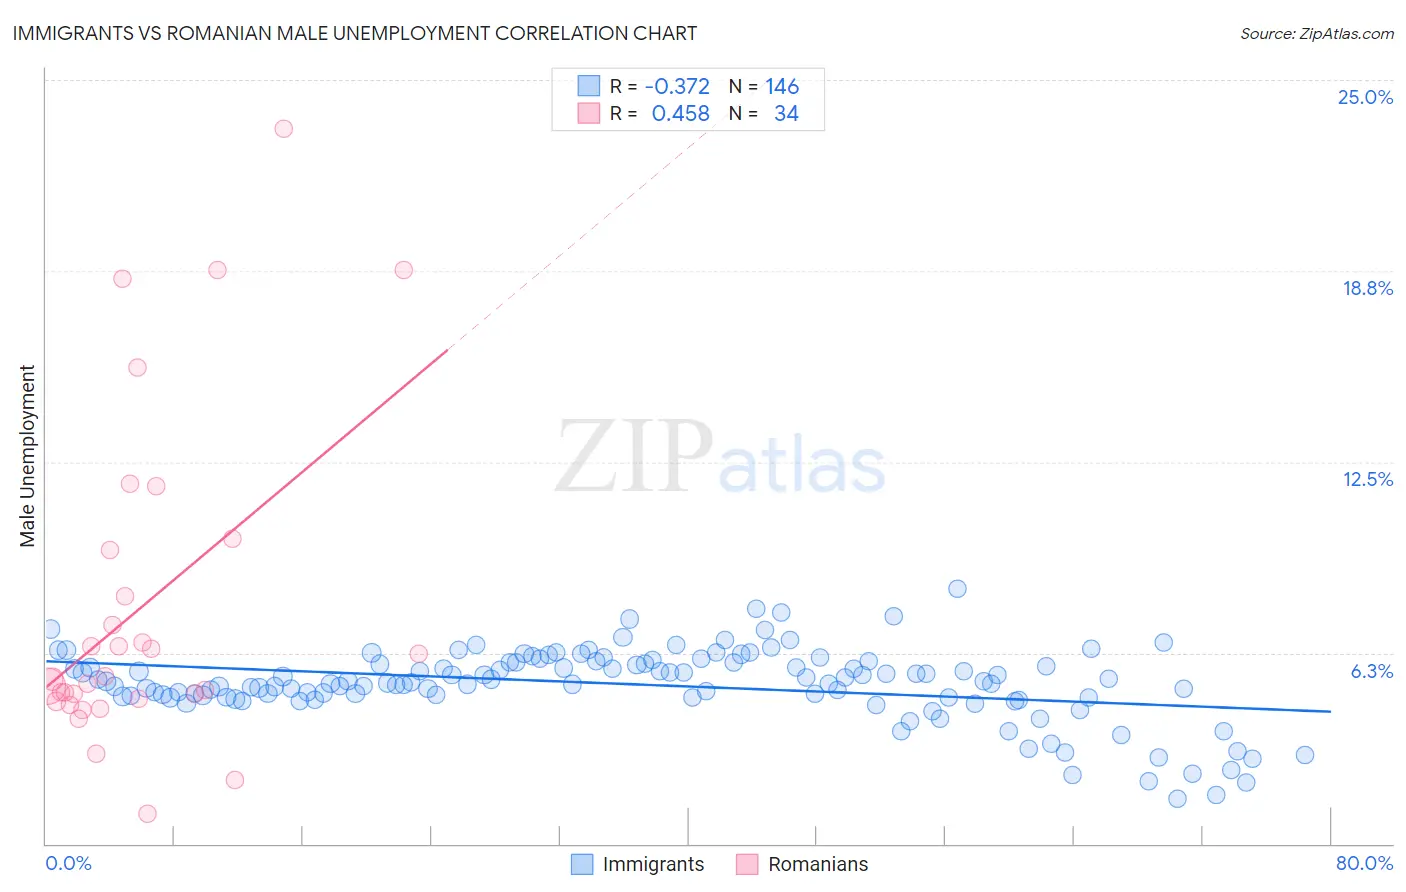
Immigrants vs Romanian Male Unemployment Correlation Chart
The statistical analysis conducted on geographies consisting of 566,323,513 people shows a mild negative correlation between the proportion of Immigrants and unemployment rate among males in the United States with a correlation coefficient (R) of -0.372 and weighted average of 5.5%. Similarly, the statistical analysis conducted on geographies consisting of 376,462,123 people shows a moderate positive correlation between the proportion of Romanians and unemployment rate among males in the United States with a correlation coefficient (R) of 0.458 and weighted average of 5.1%, a difference of 7.9%.
Male Unemployment Correlation Summary
| Measurement | Immigrants | Romanian |
| Minimum | 1.5% | 1.0% |
| Maximum | 8.4% | 23.4% |
| Range | 6.9% | 22.4% |
| Mean | 5.2% | 7.8% |
| Median | 5.3% | 5.4% |
| Interquartile 25% (IQ1) | 4.8% | 4.7% |
| Interquartile 75% (IQ3) | 5.9% | 9.6% |
| Interquartile Range (IQR) | 1.1% | 4.9% |
| Standard Deviation (Sample) | 1.2% | 5.3% |
| Standard Deviation (Population) | 1.2% | 5.3% |
Similar Demographics by Male Unemployment
Demographics Similar to Immigrants by Male Unemployment
In terms of male unemployment, the demographic groups most similar to Immigrants are Delaware (5.5%, a difference of 0.050%), Samoan (5.5%, a difference of 0.17%), Immigrants from Albania (5.5%, a difference of 0.26%), Immigrants from Western Asia (5.6%, a difference of 0.31%), and Portuguese (5.6%, a difference of 0.33%).
| Demographics | Rating | Rank | Male Unemployment |
| Immigrants | Middle Africa | 8.3 /100 | #209 | Tragic 5.5% |
| South American Indians | 7.6 /100 | #210 | Tragic 5.5% |
| Israelis | 7.4 /100 | #211 | Tragic 5.5% |
| Hmong | 7.0 /100 | #212 | Tragic 5.5% |
| Ugandans | 6.3 /100 | #213 | Tragic 5.5% |
| Puget Sound Salish | 5.6 /100 | #214 | Tragic 5.5% |
| Samoans | 4.9 /100 | #215 | Tragic 5.5% |
| Immigrants | Immigrants | 4.3 /100 | #216 | Tragic 5.5% |
| Delaware | 4.2 /100 | #217 | Tragic 5.5% |
| Immigrants | Albania | 3.6 /100 | #218 | Tragic 5.5% |
| Immigrants | Western Asia | 3.5 /100 | #219 | Tragic 5.6% |
| Portuguese | 3.5 /100 | #220 | Tragic 5.6% |
| Soviet Union | 3.2 /100 | #221 | Tragic 5.6% |
| Immigrants | Micronesia | 2.9 /100 | #222 | Tragic 5.6% |
| Creek | 2.6 /100 | #223 | Tragic 5.6% |
Demographics Similar to Romanians by Male Unemployment
In terms of male unemployment, the demographic groups most similar to Romanians are Immigrants from Asia (5.1%, a difference of 0.030%), Immigrants from Denmark (5.1%, a difference of 0.070%), Immigrants from Moldova (5.1%, a difference of 0.080%), Immigrants from Austria (5.1%, a difference of 0.080%), and Estonian (5.1%, a difference of 0.12%).
| Demographics | Rating | Rank | Male Unemployment |
| Ethiopians | 91.3 /100 | #107 | Exceptional 5.1% |
| Immigrants | Nicaragua | 91.2 /100 | #108 | Exceptional 5.1% |
| Immigrants | Pakistan | 90.9 /100 | #109 | Exceptional 5.1% |
| Immigrants | England | 90.8 /100 | #110 | Exceptional 5.1% |
| Immigrants | Eastern Asia | 90.8 /100 | #111 | Exceptional 5.1% |
| Immigrants | Moldova | 90.3 /100 | #112 | Exceptional 5.1% |
| Immigrants | Austria | 90.3 /100 | #113 | Exceptional 5.1% |
| Romanians | 89.8 /100 | #114 | Excellent 5.1% |
| Immigrants | Asia | 89.6 /100 | #115 | Excellent 5.1% |
| Immigrants | Denmark | 89.4 /100 | #116 | Excellent 5.1% |
| Estonians | 89.0 /100 | #117 | Excellent 5.1% |
| Cypriots | 88.8 /100 | #118 | Excellent 5.1% |
| French Canadians | 88.6 /100 | #119 | Excellent 5.1% |
| Ukrainians | 88.4 /100 | #120 | Excellent 5.1% |
| Mongolians | 88.4 /100 | #121 | Excellent 5.1% |