Immigrants from Kazakhstan vs Romanian Male Unemployment
COMPARE
Immigrants from Kazakhstan
Romanian
Male Unemployment
Male Unemployment Comparison
Immigrants from Kazakhstan
Romanians
5.3%
MALE UNEMPLOYMENT
50.8/ 100
METRIC RATING
172nd/ 347
METRIC RANK
5.1%
MALE UNEMPLOYMENT
89.8/ 100
METRIC RATING
114th/ 347
METRIC RANK
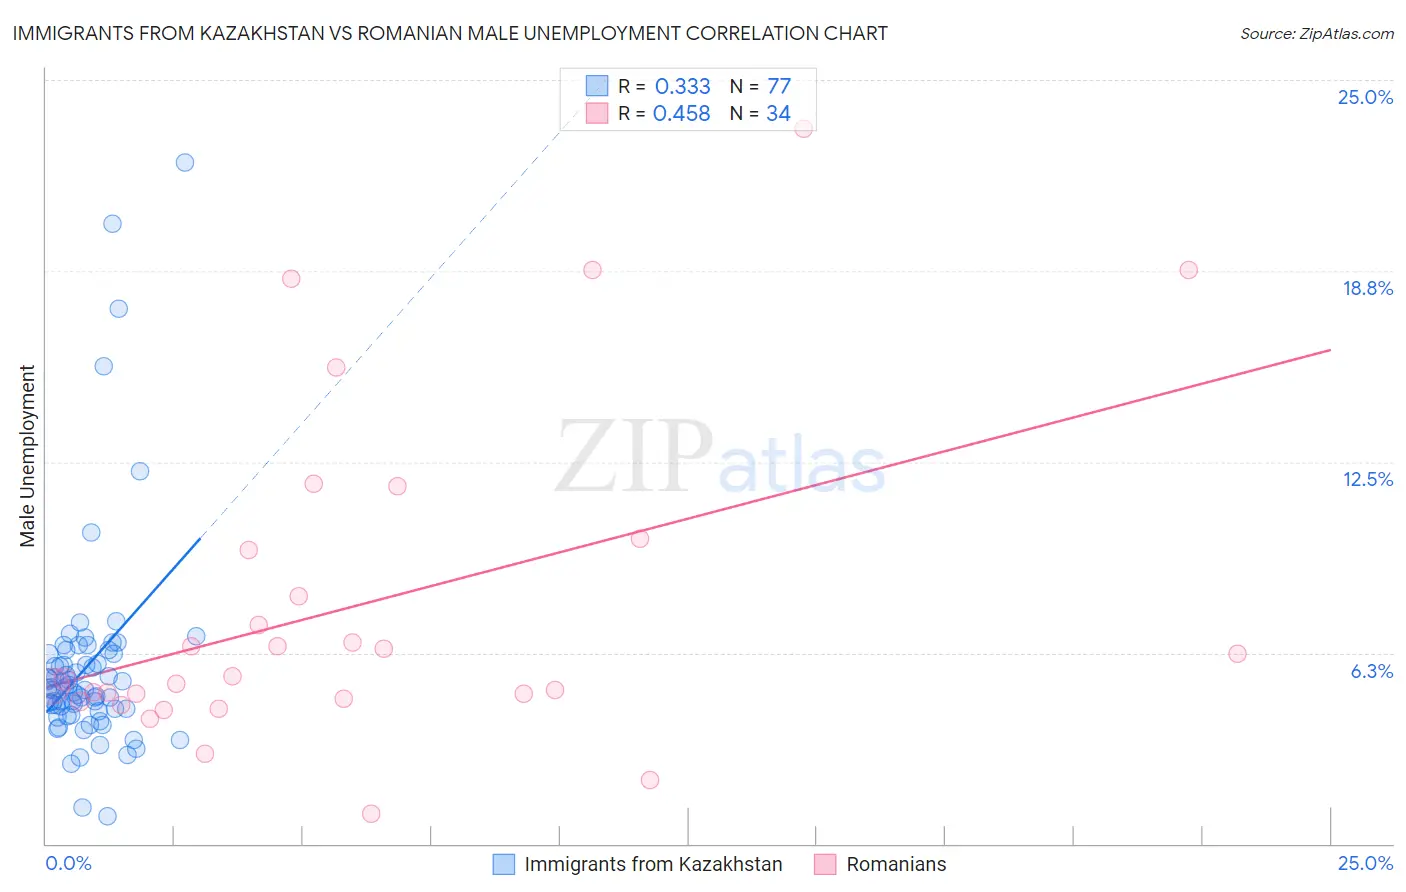
Immigrants from Kazakhstan vs Romanian Male Unemployment Correlation Chart
The statistical analysis conducted on geographies consisting of 124,296,316 people shows a mild positive correlation between the proportion of Immigrants from Kazakhstan and unemployment rate among males in the United States with a correlation coefficient (R) of 0.333 and weighted average of 5.3%. Similarly, the statistical analysis conducted on geographies consisting of 376,462,123 people shows a moderate positive correlation between the proportion of Romanians and unemployment rate among males in the United States with a correlation coefficient (R) of 0.458 and weighted average of 5.1%, a difference of 3.2%.
Male Unemployment Correlation Summary
| Measurement | Immigrants from Kazakhstan | Romanian |
| Minimum | 0.90% | 1.0% |
| Maximum | 22.3% | 23.4% |
| Range | 21.4% | 22.4% |
| Mean | 5.8% | 7.8% |
| Median | 5.1% | 5.4% |
| Interquartile 25% (IQ1) | 4.4% | 4.7% |
| Interquartile 75% (IQ3) | 6.2% | 9.6% |
| Interquartile Range (IQR) | 1.8% | 4.9% |
| Standard Deviation (Sample) | 3.5% | 5.3% |
| Standard Deviation (Population) | 3.5% | 5.3% |
Similar Demographics by Male Unemployment
Demographics Similar to Immigrants from Kazakhstan by Male Unemployment
In terms of male unemployment, the demographic groups most similar to Immigrants from Kazakhstan are Immigrants from Russia (5.3%, a difference of 0.010%), Immigrants from Iran (5.3%, a difference of 0.050%), Peruvian (5.3%, a difference of 0.060%), Immigrants from Iraq (5.3%, a difference of 0.16%), and Immigrants from Eastern Europe (5.3%, a difference of 0.19%).
| Demographics | Rating | Rank | Male Unemployment |
| South Americans | 60.6 /100 | #165 | Good 5.3% |
| Immigrants | Morocco | 60.2 /100 | #166 | Good 5.3% |
| Immigrants | Vietnam | 58.1 /100 | #167 | Average 5.3% |
| Immigrants | Ireland | 57.7 /100 | #168 | Average 5.3% |
| Immigrants | Congo | 57.4 /100 | #169 | Average 5.3% |
| Immigrants | Eastern Europe | 54.1 /100 | #170 | Average 5.3% |
| Peruvians | 51.9 /100 | #171 | Average 5.3% |
| Immigrants | Kazakhstan | 50.8 /100 | #172 | Average 5.3% |
| Immigrants | Russia | 50.7 /100 | #173 | Average 5.3% |
| Immigrants | Iran | 50.0 /100 | #174 | Average 5.3% |
| Immigrants | Iraq | 48.1 /100 | #175 | Average 5.3% |
| Immigrants | Poland | 46.0 /100 | #176 | Average 5.3% |
| Immigrants | Peru | 44.6 /100 | #177 | Average 5.3% |
| Osage | 42.5 /100 | #178 | Average 5.3% |
| Immigrants | Oceania | 40.8 /100 | #179 | Average 5.3% |
Demographics Similar to Romanians by Male Unemployment
In terms of male unemployment, the demographic groups most similar to Romanians are Immigrants from Asia (5.1%, a difference of 0.030%), Immigrants from Denmark (5.1%, a difference of 0.070%), Immigrants from Moldova (5.1%, a difference of 0.080%), Immigrants from Austria (5.1%, a difference of 0.080%), and Estonian (5.1%, a difference of 0.12%).
| Demographics | Rating | Rank | Male Unemployment |
| Ethiopians | 91.3 /100 | #107 | Exceptional 5.1% |
| Immigrants | Nicaragua | 91.2 /100 | #108 | Exceptional 5.1% |
| Immigrants | Pakistan | 90.9 /100 | #109 | Exceptional 5.1% |
| Immigrants | England | 90.8 /100 | #110 | Exceptional 5.1% |
| Immigrants | Eastern Asia | 90.8 /100 | #111 | Exceptional 5.1% |
| Immigrants | Moldova | 90.3 /100 | #112 | Exceptional 5.1% |
| Immigrants | Austria | 90.3 /100 | #113 | Exceptional 5.1% |
| Romanians | 89.8 /100 | #114 | Excellent 5.1% |
| Immigrants | Asia | 89.6 /100 | #115 | Excellent 5.1% |
| Immigrants | Denmark | 89.4 /100 | #116 | Excellent 5.1% |
| Estonians | 89.0 /100 | #117 | Excellent 5.1% |
| Cypriots | 88.8 /100 | #118 | Excellent 5.1% |
| French Canadians | 88.6 /100 | #119 | Excellent 5.1% |
| Ukrainians | 88.4 /100 | #120 | Excellent 5.1% |
| Mongolians | 88.4 /100 | #121 | Excellent 5.1% |