Immigrants vs Romanian Householder Income Under 25 years
COMPARE
Immigrants
Romanian
Householder Income Under 25 years
Householder Income Under 25 years Comparison
Immigrants
Romanians
$53,201
HOUSEHOLDER INCOME UNDER 25 YEARS
92.2/ 100
METRIC RATING
133rd/ 347
METRIC RANK
$53,632
HOUSEHOLDER INCOME UNDER 25 YEARS
97.2/ 100
METRIC RATING
113th/ 347
METRIC RANK
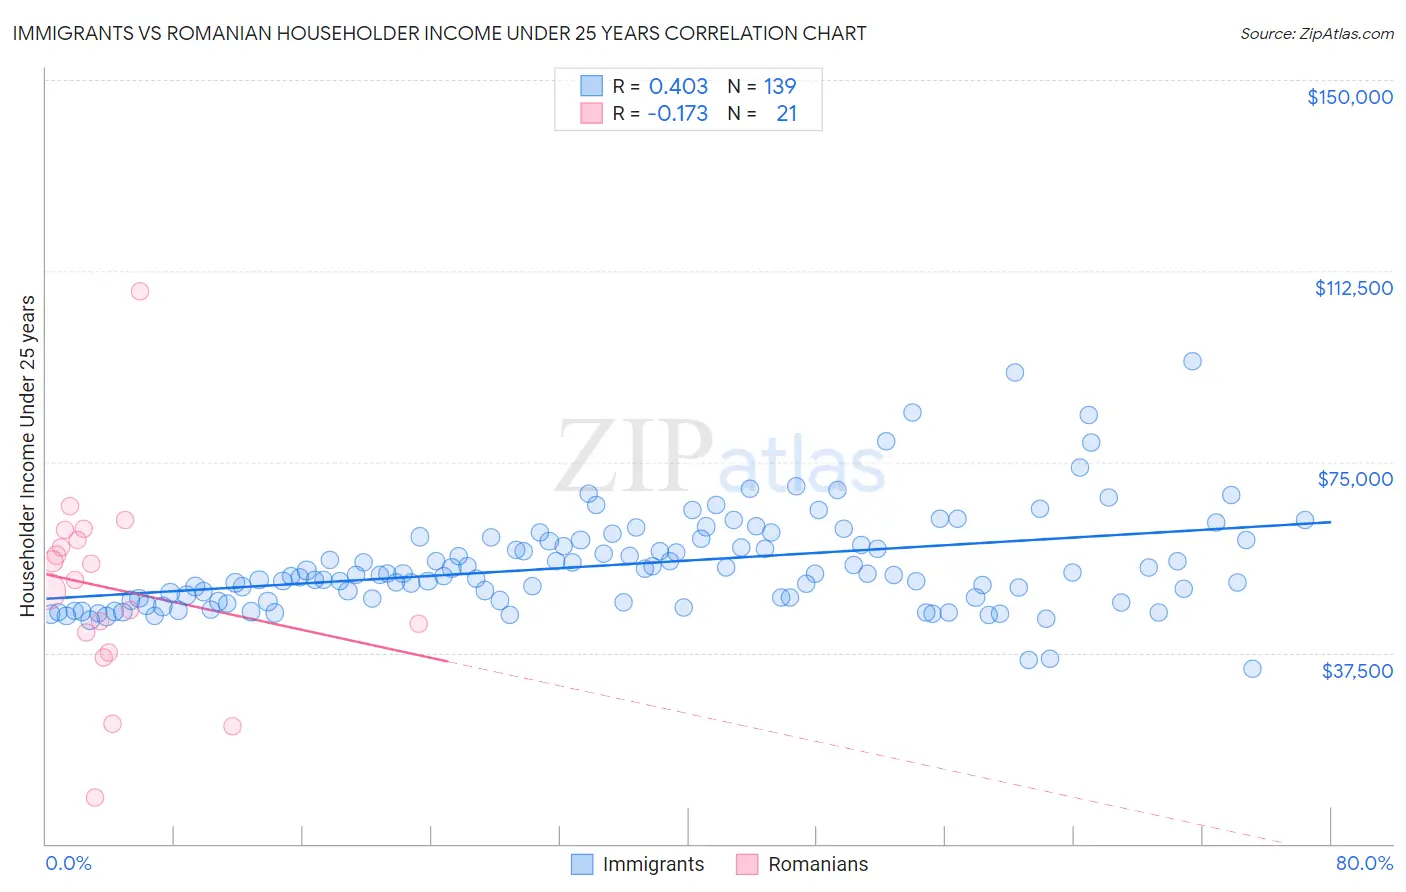
Immigrants vs Romanian Householder Income Under 25 years Correlation Chart
The statistical analysis conducted on geographies consisting of 440,888,277 people shows a moderate positive correlation between the proportion of Immigrants and household income with householder under the age of 25 in the United States with a correlation coefficient (R) of 0.403 and weighted average of $53,201. Similarly, the statistical analysis conducted on geographies consisting of 317,146,706 people shows a poor negative correlation between the proportion of Romanians and household income with householder under the age of 25 in the United States with a correlation coefficient (R) of -0.173 and weighted average of $53,632, a difference of 0.81%.
Householder Income Under 25 years Correlation Summary
| Measurement | Immigrants | Romanian |
| Minimum | $34,271 | $9,000 |
| Maximum | $94,688 | $108,452 |
| Range | $60,417 | $99,452 |
| Mean | $54,792 | $50,147 |
| Median | $52,736 | $51,890 |
| Interquartile 25% (IQ1) | $47,750 | $39,493 |
| Interquartile 75% (IQ3) | $59,631 | $60,663 |
| Interquartile Range (IQR) | $11,881 | $21,170 |
| Standard Deviation (Sample) | $9,932 | $20,018 |
| Standard Deviation (Population) | $9,896 | $19,536 |
Demographics Similar to Immigrants and Romanians by Householder Income Under 25 years
In terms of householder income under 25 years, the demographic groups most similar to Immigrants are Moroccan ($53,256, a difference of 0.10%), Immigrants from Nicaragua ($53,266, a difference of 0.12%), Nicaraguan ($53,275, a difference of 0.14%), New Zealander ($53,294, a difference of 0.17%), and Immigrants from North America ($53,307, a difference of 0.20%). Similarly, the demographic groups most similar to Romanians are Immigrants from Sweden ($53,621, a difference of 0.020%), Immigrants from Albania ($53,597, a difference of 0.070%), Immigrants from Spain ($53,560, a difference of 0.14%), Lithuanian ($53,552, a difference of 0.15%), and Immigrants from Switzerland ($53,528, a difference of 0.20%).
| Demographics | Rating | Rank | Householder Income Under 25 years |
| Romanians | 97.2 /100 | #113 | Exceptional $53,632 |
| Immigrants | Sweden | 97.1 /100 | #114 | Exceptional $53,621 |
| Immigrants | Albania | 96.9 /100 | #115 | Exceptional $53,597 |
| Immigrants | Spain | 96.6 /100 | #116 | Exceptional $53,560 |
| Lithuanians | 96.6 /100 | #117 | Exceptional $53,552 |
| Immigrants | Switzerland | 96.3 /100 | #118 | Exceptional $53,528 |
| Italians | 95.4 /100 | #119 | Exceptional $53,426 |
| Guamanians/Chamorros | 95.3 /100 | #120 | Exceptional $53,423 |
| Immigrants | Canada | 95.2 /100 | #121 | Exceptional $53,411 |
| Immigrants | Ethiopia | 95.2 /100 | #122 | Exceptional $53,408 |
| Immigrants | Iraq | 94.9 /100 | #123 | Exceptional $53,384 |
| Colombians | 94.6 /100 | #124 | Exceptional $53,357 |
| Pakistanis | 94.1 /100 | #125 | Exceptional $53,325 |
| Immigrants | Serbia | 94.1 /100 | #126 | Exceptional $53,321 |
| Immigrants | North America | 93.9 /100 | #127 | Exceptional $53,307 |
| Immigrants | Bulgaria | 93.9 /100 | #128 | Exceptional $53,305 |
| New Zealanders | 93.7 /100 | #129 | Exceptional $53,294 |
| Nicaraguans | 93.4 /100 | #130 | Exceptional $53,275 |
| Immigrants | Nicaragua | 93.3 /100 | #131 | Exceptional $53,266 |
| Moroccans | 93.1 /100 | #132 | Exceptional $53,256 |
| Immigrants | Immigrants | 92.2 /100 | #133 | Exceptional $53,201 |