Immigrants vs Guatemalan Male Unemployment
COMPARE
Immigrants
Guatemalan
Male Unemployment
Male Unemployment Comparison
Immigrants
Guatemalans
5.5%
MALE UNEMPLOYMENT
4.3/ 100
METRIC RATING
216th/ 347
METRIC RANK
5.6%
MALE UNEMPLOYMENT
1.2/ 100
METRIC RATING
236th/ 347
METRIC RANK
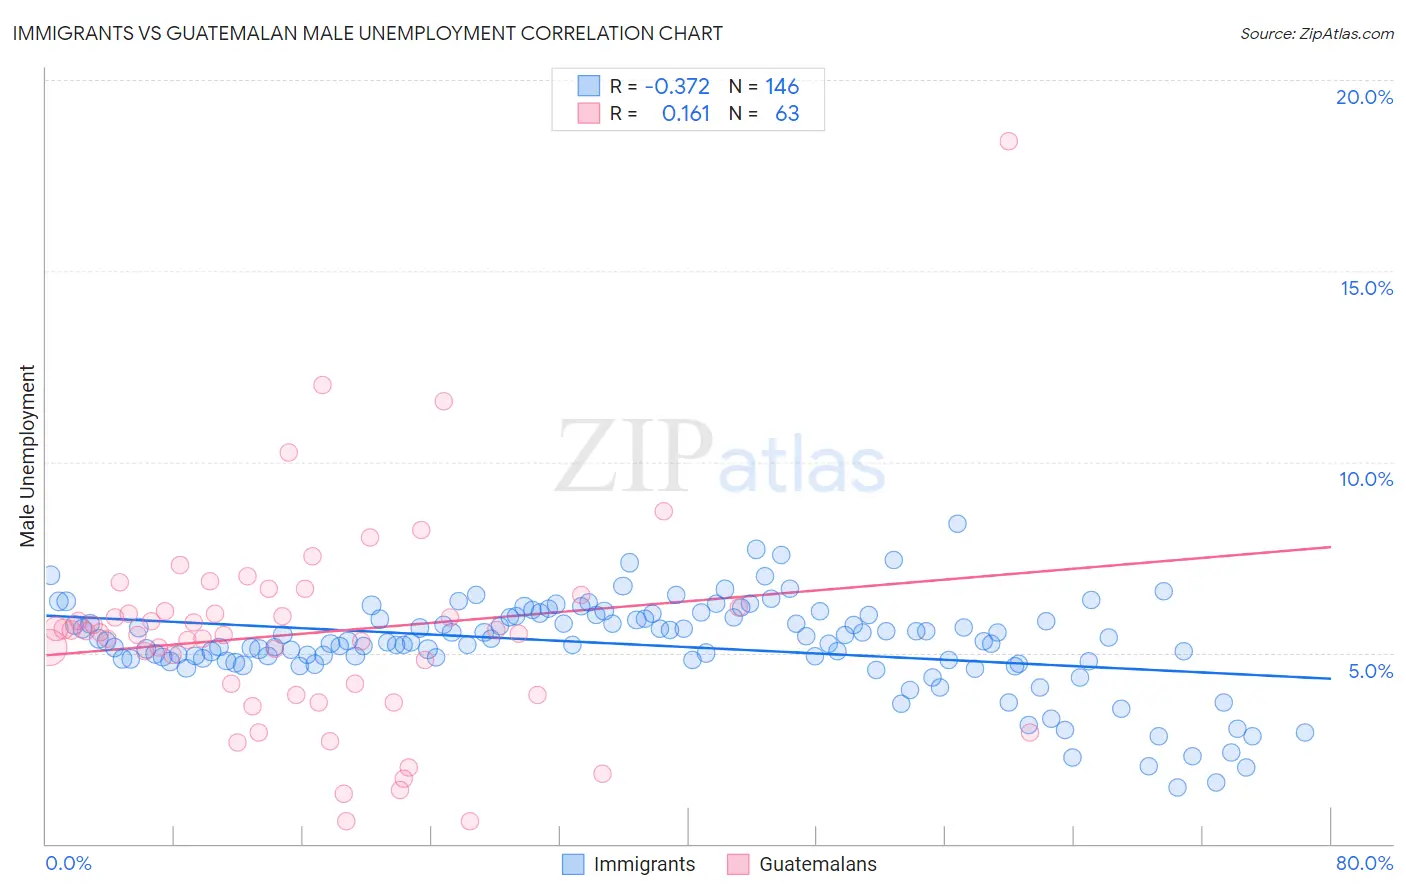
Immigrants vs Guatemalan Male Unemployment Correlation Chart
The statistical analysis conducted on geographies consisting of 566,323,513 people shows a mild negative correlation between the proportion of Immigrants and unemployment rate among males in the United States with a correlation coefficient (R) of -0.372 and weighted average of 5.5%. Similarly, the statistical analysis conducted on geographies consisting of 407,851,547 people shows a poor positive correlation between the proportion of Guatemalans and unemployment rate among males in the United States with a correlation coefficient (R) of 0.161 and weighted average of 5.6%, a difference of 1.8%.
Male Unemployment Correlation Summary
| Measurement | Immigrants | Guatemalan |
| Minimum | 1.5% | 0.60% |
| Maximum | 8.4% | 18.4% |
| Range | 6.9% | 17.8% |
| Mean | 5.2% | 5.5% |
| Median | 5.3% | 5.5% |
| Interquartile 25% (IQ1) | 4.8% | 3.9% |
| Interquartile 75% (IQ3) | 5.9% | 6.2% |
| Interquartile Range (IQR) | 1.1% | 2.3% |
| Standard Deviation (Sample) | 1.2% | 2.8% |
| Standard Deviation (Population) | 1.2% | 2.8% |
Demographics Similar to Immigrants and Guatemalans by Male Unemployment
In terms of male unemployment, the demographic groups most similar to Immigrants are Delaware (5.5%, a difference of 0.050%), Immigrants from Albania (5.5%, a difference of 0.26%), Immigrants from Western Asia (5.6%, a difference of 0.31%), Portuguese (5.6%, a difference of 0.33%), and Soviet Union (5.6%, a difference of 0.44%). Similarly, the demographic groups most similar to Guatemalans are Immigrants from Honduras (5.6%, a difference of 0.32%), Immigrants from Somalia (5.6%, a difference of 0.34%), Somali (5.6%, a difference of 0.35%), Moroccan (5.6%, a difference of 0.42%), and Choctaw (5.6%, a difference of 0.45%).
| Demographics | Rating | Rank | Male Unemployment |
| Immigrants | Immigrants | 4.3 /100 | #216 | Tragic 5.5% |
| Delaware | 4.2 /100 | #217 | Tragic 5.5% |
| Immigrants | Albania | 3.6 /100 | #218 | Tragic 5.5% |
| Immigrants | Western Asia | 3.5 /100 | #219 | Tragic 5.6% |
| Portuguese | 3.5 /100 | #220 | Tragic 5.6% |
| Soviet Union | 3.2 /100 | #221 | Tragic 5.6% |
| Immigrants | Micronesia | 2.9 /100 | #222 | Tragic 5.6% |
| Creek | 2.6 /100 | #223 | Tragic 5.6% |
| Cherokee | 2.4 /100 | #224 | Tragic 5.6% |
| Panamanians | 1.9 /100 | #225 | Tragic 5.6% |
| Immigrants | Cambodia | 1.8 /100 | #226 | Tragic 5.6% |
| Immigrants | Panama | 1.8 /100 | #227 | Tragic 5.6% |
| Seminole | 1.8 /100 | #228 | Tragic 5.6% |
| Central Americans | 1.8 /100 | #229 | Tragic 5.6% |
| Immigrants | Africa | 1.7 /100 | #230 | Tragic 5.6% |
| Choctaw | 1.6 /100 | #231 | Tragic 5.6% |
| Moroccans | 1.6 /100 | #232 | Tragic 5.6% |
| Somalis | 1.5 /100 | #233 | Tragic 5.6% |
| Immigrants | Somalia | 1.5 /100 | #234 | Tragic 5.6% |
| Immigrants | Honduras | 1.5 /100 | #235 | Tragic 5.6% |
| Guatemalans | 1.2 /100 | #236 | Tragic 5.6% |