Immigrants from Western Africa vs Syrian Unemployment
COMPARE
Immigrants from Western Africa
Syrian
Unemployment
Unemployment Comparison
Immigrants from Western Africa
Syrians
6.0%
UNEMPLOYMENT
0.0/ 100
METRIC RATING
280th/ 347
METRIC RANK
5.2%
UNEMPLOYMENT
77.7/ 100
METRIC RATING
149th/ 347
METRIC RANK
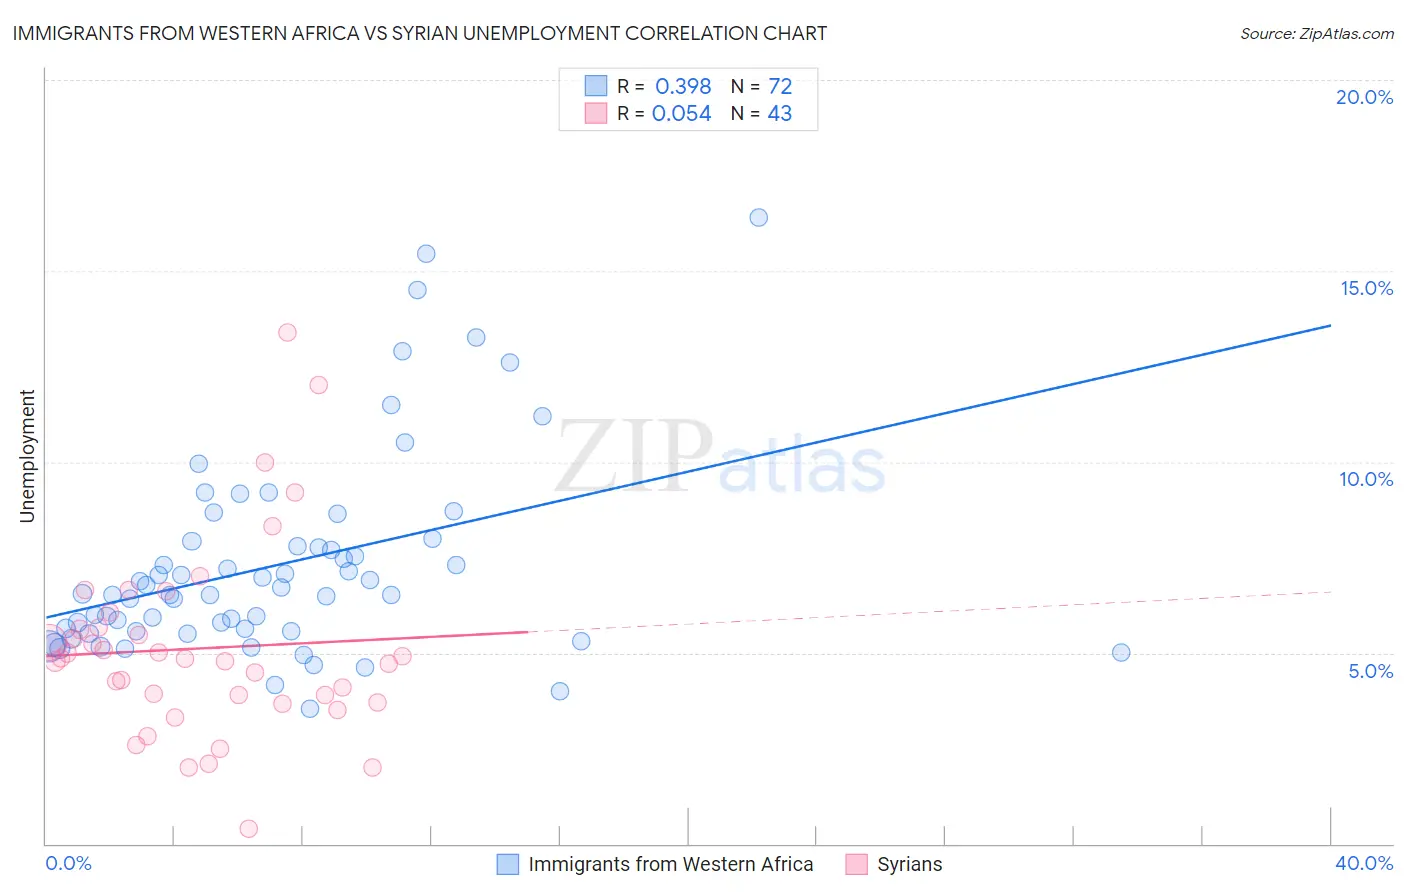
Immigrants from Western Africa vs Syrian Unemployment Correlation Chart
The statistical analysis conducted on geographies consisting of 357,683,143 people shows a mild positive correlation between the proportion of Immigrants from Western Africa and unemployment in the United States with a correlation coefficient (R) of 0.398 and weighted average of 6.0%. Similarly, the statistical analysis conducted on geographies consisting of 266,191,069 people shows a slight positive correlation between the proportion of Syrians and unemployment in the United States with a correlation coefficient (R) of 0.054 and weighted average of 5.2%, a difference of 16.7%.
Unemployment Correlation Summary
| Measurement | Immigrants from Western Africa | Syrian |
| Minimum | 3.5% | 0.40% |
| Maximum | 16.4% | 13.4% |
| Range | 12.9% | 13.0% |
| Mean | 7.3% | 5.1% |
| Median | 6.5% | 4.8% |
| Interquartile 25% (IQ1) | 5.6% | 3.7% |
| Interquartile 75% (IQ3) | 7.9% | 5.7% |
| Interquartile Range (IQR) | 2.3% | 2.0% |
| Standard Deviation (Sample) | 2.7% | 2.5% |
| Standard Deviation (Population) | 2.6% | 2.5% |
Similar Demographics by Unemployment
Demographics Similar to Immigrants from Western Africa by Unemployment
In terms of unemployment, the demographic groups most similar to Immigrants from Western Africa are Immigrants from Mexico (6.0%, a difference of 0.0%), Ghanaian (6.0%, a difference of 0.43%), African (6.1%, a difference of 0.58%), Immigrants from the Azores (6.1%, a difference of 0.64%), and Armenian (6.0%, a difference of 0.73%).
| Demographics | Rating | Rank | Unemployment |
| Immigrants | Fiji | 0.0 /100 | #273 | Tragic 5.9% |
| Bahamians | 0.0 /100 | #274 | Tragic 5.9% |
| Immigrants | Latin America | 0.0 /100 | #275 | Tragic 5.9% |
| Immigrants | Central America | 0.0 /100 | #276 | Tragic 6.0% |
| Armenians | 0.0 /100 | #277 | Tragic 6.0% |
| Ghanaians | 0.0 /100 | #278 | Tragic 6.0% |
| Immigrants | Mexico | 0.0 /100 | #279 | Tragic 6.0% |
| Immigrants | Western Africa | 0.0 /100 | #280 | Tragic 6.0% |
| Africans | 0.0 /100 | #281 | Tragic 6.1% |
| Immigrants | Azores | 0.0 /100 | #282 | Tragic 6.1% |
| Immigrants | Ghana | 0.0 /100 | #283 | Tragic 6.1% |
| Aleuts | 0.0 /100 | #284 | Tragic 6.1% |
| Immigrants | Senegal | 0.0 /100 | #285 | Tragic 6.1% |
| Immigrants | Caribbean | 0.0 /100 | #286 | Tragic 6.2% |
| Nepalese | 0.0 /100 | #287 | Tragic 6.2% |
Demographics Similar to Syrians by Unemployment
In terms of unemployment, the demographic groups most similar to Syrians are Immigrants from Italy (5.1%, a difference of 0.13%), Potawatomi (5.2%, a difference of 0.14%), Immigrants from Eastern Europe (5.2%, a difference of 0.21%), Immigrants from Hong Kong (5.2%, a difference of 0.22%), and Egyptian (5.2%, a difference of 0.22%).
| Demographics | Rating | Rank | Unemployment |
| Immigrants | Pakistan | 83.2 /100 | #142 | Excellent 5.1% |
| Immigrants | Chile | 82.8 /100 | #143 | Excellent 5.1% |
| Indonesians | 82.3 /100 | #144 | Excellent 5.1% |
| Immigrants | Norway | 81.8 /100 | #145 | Excellent 5.1% |
| Immigrants | Asia | 81.8 /100 | #146 | Excellent 5.1% |
| Indians (Asian) | 81.6 /100 | #147 | Excellent 5.1% |
| Immigrants | Italy | 79.1 /100 | #148 | Good 5.1% |
| Syrians | 77.7 /100 | #149 | Good 5.2% |
| Potawatomi | 76.2 /100 | #150 | Good 5.2% |
| Immigrants | Eastern Europe | 75.3 /100 | #151 | Good 5.2% |
| Immigrants | Hong Kong | 75.2 /100 | #152 | Good 5.2% |
| Egyptians | 75.2 /100 | #153 | Good 5.2% |
| Immigrants | China | 74.7 /100 | #154 | Good 5.2% |
| Immigrants | Northern Africa | 71.3 /100 | #155 | Good 5.2% |
| Immigrants | Kazakhstan | 70.4 /100 | #156 | Good 5.2% |