Immigrants from West Indies vs Blackfeet Female Poverty Among 25-34 Year Olds
COMPARE
Immigrants from West Indies
Blackfeet
Female Poverty Among 25-34 Year Olds
Female Poverty Among 25-34 Year Olds Comparison
Immigrants from West Indies
Blackfeet
15.1%
FEMALE POVERTY AMONG 25-34 YEAR OLDS
0.4/ 100
METRIC RATING
253rd/ 347
METRIC RANK
16.7%
FEMALE POVERTY AMONG 25-34 YEAR OLDS
0.0/ 100
METRIC RATING
298th/ 347
METRIC RANK
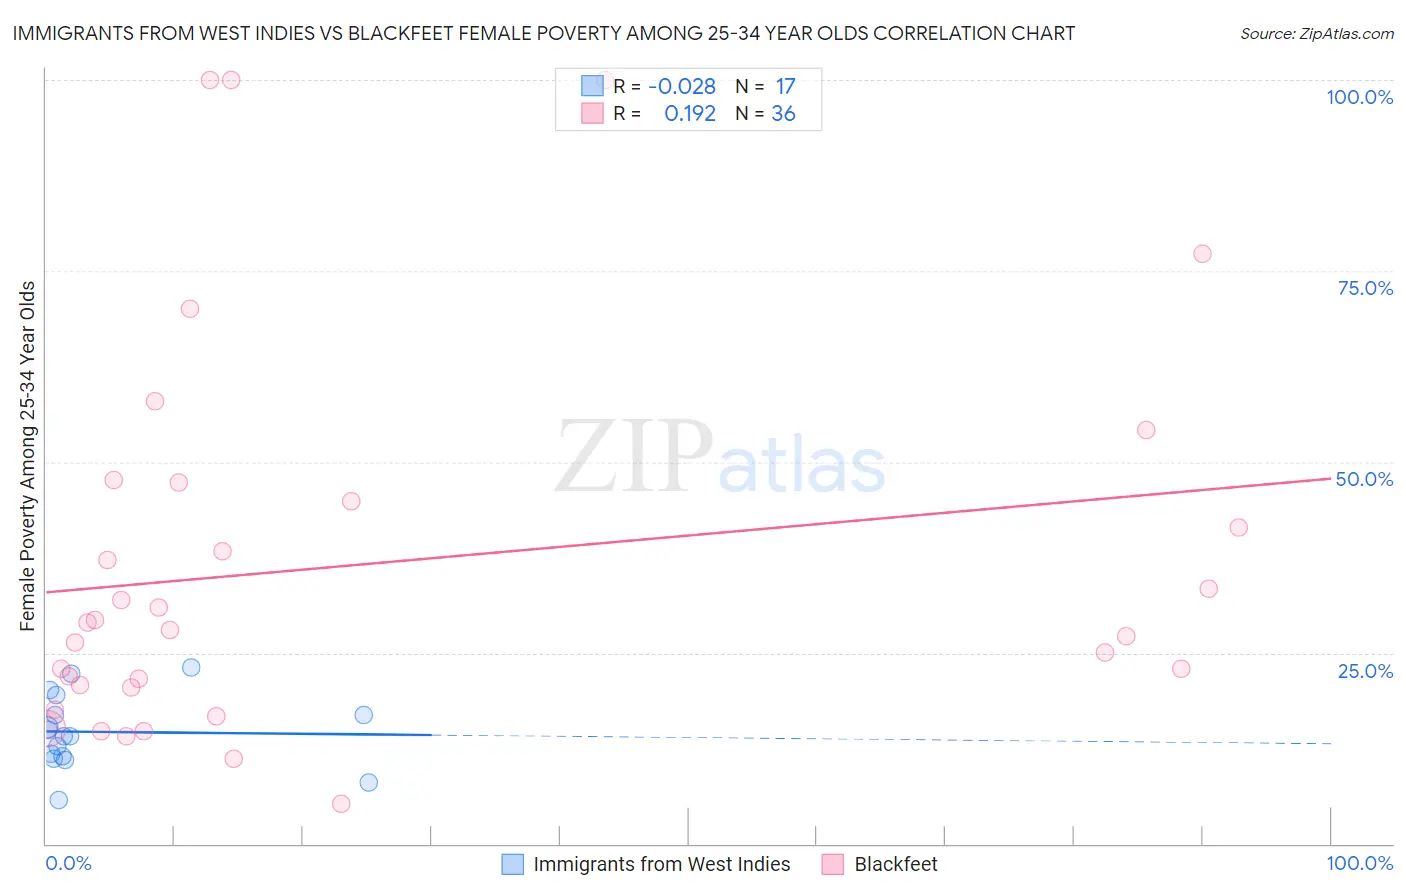
Immigrants from West Indies vs Blackfeet Female Poverty Among 25-34 Year Olds Correlation Chart
The statistical analysis conducted on geographies consisting of 72,346,963 people shows no correlation between the proportion of Immigrants from West Indies and poverty level among females between the ages 25 and 34 in the United States with a correlation coefficient (R) of -0.028 and weighted average of 15.1%. Similarly, the statistical analysis conducted on geographies consisting of 307,106,186 people shows a poor positive correlation between the proportion of Blackfeet and poverty level among females between the ages 25 and 34 in the United States with a correlation coefficient (R) of 0.192 and weighted average of 16.7%, a difference of 10.8%.
Female Poverty Among 25-34 Year Olds Correlation Summary
| Measurement | Immigrants from West Indies | Blackfeet |
| Minimum | 5.8% | 5.2% |
| Maximum | 23.1% | 100.0% |
| Range | 17.3% | 94.8% |
| Mean | 14.6% | 36.6% |
| Median | 14.2% | 28.4% |
| Interquartile 25% (IQ1) | 11.3% | 20.6% |
| Interquartile 75% (IQ3) | 18.2% | 46.1% |
| Interquartile Range (IQR) | 6.9% | 25.5% |
| Standard Deviation (Sample) | 4.8% | 25.2% |
| Standard Deviation (Population) | 4.6% | 24.8% |
Similar Demographics by Female Poverty Among 25-34 Year Olds
Demographics Similar to Immigrants from West Indies by Female Poverty Among 25-34 Year Olds
In terms of female poverty among 25-34 year olds, the demographic groups most similar to Immigrants from West Indies are Somali (15.1%, a difference of 0.080%), Belizean (15.1%, a difference of 0.14%), Haitian (15.0%, a difference of 0.31%), Immigrants from Laos (15.2%, a difference of 0.47%), and Immigrants from El Salvador (15.0%, a difference of 0.50%).
| Demographics | Rating | Rank | Female Poverty Among 25-34 Year Olds |
| Jamaicans | 1.0 /100 | #246 | Tragic 14.8% |
| German Russians | 0.8 /100 | #247 | Tragic 14.9% |
| Immigrants | Western Africa | 0.8 /100 | #248 | Tragic 14.9% |
| Immigrants | Haiti | 0.5 /100 | #249 | Tragic 15.0% |
| Immigrants | El Salvador | 0.5 /100 | #250 | Tragic 15.0% |
| Haitians | 0.5 /100 | #251 | Tragic 15.0% |
| Belizeans | 0.4 /100 | #252 | Tragic 15.1% |
| Immigrants | West Indies | 0.4 /100 | #253 | Tragic 15.1% |
| Somalis | 0.4 /100 | #254 | Tragic 15.1% |
| Immigrants | Laos | 0.3 /100 | #255 | Tragic 15.2% |
| West Indians | 0.3 /100 | #256 | Tragic 15.2% |
| Immigrants | Burma/Myanmar | 0.3 /100 | #257 | Tragic 15.2% |
| Nepalese | 0.2 /100 | #258 | Tragic 15.2% |
| Immigrants | Cuba | 0.2 /100 | #259 | Tragic 15.2% |
| Marshallese | 0.2 /100 | #260 | Tragic 15.3% |
Demographics Similar to Blackfeet by Female Poverty Among 25-34 Year Olds
In terms of female poverty among 25-34 year olds, the demographic groups most similar to Blackfeet are Spanish American (16.7%, a difference of 0.040%), U.S. Virgin Islander (16.7%, a difference of 0.19%), Immigrants from Congo (16.7%, a difference of 0.20%), Alaska Native (16.8%, a difference of 0.31%), and Immigrants from Guatemala (16.6%, a difference of 0.51%).
| Demographics | Rating | Rank | Female Poverty Among 25-34 Year Olds |
| Comanche | 0.0 /100 | #291 | Tragic 16.5% |
| Immigrants | Dominica | 0.0 /100 | #292 | Tragic 16.5% |
| Potawatomi | 0.0 /100 | #293 | Tragic 16.5% |
| Immigrants | Central America | 0.0 /100 | #294 | Tragic 16.6% |
| Mexicans | 0.0 /100 | #295 | Tragic 16.6% |
| Hispanics or Latinos | 0.0 /100 | #296 | Tragic 16.6% |
| Immigrants | Guatemala | 0.0 /100 | #297 | Tragic 16.6% |
| Blackfeet | 0.0 /100 | #298 | Tragic 16.7% |
| Spanish Americans | 0.0 /100 | #299 | Tragic 16.7% |
| U.S. Virgin Islanders | 0.0 /100 | #300 | Tragic 16.7% |
| Immigrants | Congo | 0.0 /100 | #301 | Tragic 16.7% |
| Alaska Natives | 0.0 /100 | #302 | Tragic 16.8% |
| Immigrants | Mexico | 0.0 /100 | #303 | Tragic 16.8% |
| Hondurans | 0.0 /100 | #304 | Tragic 16.9% |
| Immigrants | Cabo Verde | 0.0 /100 | #305 | Tragic 16.9% |