Immigrants from Albania vs Turkish Unemployment Among Youth under 25 years

COMPARE

Immigrants from Albania
Race
Ancestry
AfghanAfricanAlaska NativeAlaskan AthabascanAlbanianAleutAlsatianAmericanApacheArabArapahoArgentineanArmenianAssyrian/Chaldean/SyriacAustralianAustrianBahamianBangladeshiBarbadianBasqueBelgianBelizeanBermudanBhutaneseBlackfeetBolivianBrazilianBritishBritish West IndianBulgarianBurmeseCajunCambodianCanadianCape VerdeanCarpatho RusynCelticCentral AmericanCentral American IndianCherokeeCheyenneChickasawChileanChineseChippewaChoctawColombianColvilleComancheCosta RicanCreeCreekCroatianCrowCubanCypriotCzechCzechoslovakianDanishDelawareDominicanDutchDutch West IndianEastern EuropeanEcuadorianEgyptianEnglishEstonianEthiopianEuropeanFijianFilipinoFinnishFrenchFrench American IndianFrench CanadianGermanGerman RussianGhanaianGreekGuamanian/ChamorroGuatemalanGuyaneseHaitianHmongHonduranHopiHoumaHungarianIcelanderIndian (Asian)IndonesianInupiatIranianIraqiIrishIroquoisIsraeliItalianJamaicanJapaneseJordanianKenyanKiowaKoreanLaotianLatvianLebaneseLiberianLithuanianLumbeeLuxembourgerMacedonianMalaysianMalteseMarshalleseMenomineeMexicanMexican American IndianMongolianMoroccanNative HawaiianNavajoNepaleseNew ZealanderNicaraguanNigerianNorthern EuropeanNorwegianOkinawanOsageOttawaPaiutePakistaniPalestinianPanamanianParaguayanPennsylvania GermanPeruvianPimaPolishPortuguesePotawatomiPuebloPuerto RicanPuget Sound SalishRomanianRussianSalvadoranSamoanScandinavianScotch-IrishScottishSeminoleSenegaleseSerbianShoshoneSierra LeoneanSiouxSlavicSlovakSloveneSomaliSouth AfricanSouth AmericanSouth American IndianSoviet UnionSpaniardSpanishSpanish AmericanSpanish American IndianSri LankanSubsaharan AfricanSudaneseSwedishSwissSyrianTaiwaneseThaiTlingit-HaidaTohono O'OdhamTonganTrinidadian and TobagonianTsimshianU.S. Virgin IslanderUgandanUkrainianUruguayanUteVenezuelanVietnameseWelshWest IndianYakamaYaquiYugoslavianYumanYup'ikZimbabwean
Immigration
NonimmigrantsImmigrantsAfghanistanAfricaAlbaniaArgentinaArmeniaAsiaAustraliaAustriaBahamasBangladeshBarbadosBelarusBelgiumBelizeBoliviaBosnia and HerzegovinaBrazilBulgariaBurma/MyanmarCabo VerdeCambodiaCameroonCanadaCaribbeanCentral AmericaChileChinaColombiaCongoCosta RicaCroatiaCubaCzechoslovakiaDenmarkDominicaDominican RepublicEastern AfricaEastern AsiaEastern EuropeEcuadorEgyptEl SalvadorEnglandEritreaEthiopiaEuropeFijiFranceGermanyGhanaGreeceGrenadaGuatemalaGuyanaHaitiHondurasHong KongHungaryIndiaIndonesiaIranIraqIrelandIsraelItalyJamaicaJapanJordanKazakhstanKenyaKoreaKuwaitLaosLatin AmericaLatviaLebanonLiberiaLithuaniaMalaysiaMexicoMicronesiaMiddle AfricaMoldovaMoroccoNepalNetherlandsNicaraguaNigeriaNorth AmericaNorth MacedoniaNorthern AfricaNorthern EuropeNorwayOceaniaPakistanPanamaPeruPhilippinesPolandPortugalRomaniaRussiaSaudi ArabiaScotlandSenegalSerbiaSierra LeoneSingaporeSomaliaSouth AfricaSouth AmericaSouth Central AsiaSouth Eastern AsiaSouthern EuropeSpainSri LankaSt. Vincent and the GrenadinesSudanSwedenSwitzerlandSyriaTaiwanThailandTrinidad and TobagoTurkeyUgandaUkraineUruguayUzbekistanVenezuelaVietnamWest IndiesWestern AfricaWestern AsiaWestern EuropeYemenZaireZimbabweAzores
Turkish
Race
Ancestry
AfghanAfricanAlaska NativeAlaskan AthabascanAlbanianAleutAlsatianAmericanApacheArabArapahoArgentineanArmenianAssyrian/Chaldean/SyriacAustralianAustrianBahamianBangladeshiBarbadianBasqueBelgianBelizeanBermudanBhutaneseBlackfeetBolivianBrazilianBritishBritish West IndianBulgarianBurmeseCajunCambodianCanadianCape VerdeanCarpatho RusynCelticCentral AmericanCentral American IndianCherokeeCheyenneChickasawChileanChineseChippewaChoctawColombianColvilleComancheCosta RicanCreeCreekCroatianCrowCubanCypriotCzechCzechoslovakianDanishDelawareDominicanDutchDutch West IndianEastern EuropeanEcuadorianEgyptianEnglishEstonianEthiopianEuropeanFijianFilipinoFinnishFrenchFrench American IndianFrench CanadianGermanGerman RussianGhanaianGreekGuamanian/ChamorroGuatemalanGuyaneseHaitianHmongHonduranHopiHoumaHungarianIcelanderIndian (Asian)IndonesianInupiatIranianIraqiIrishIroquoisIsraeliItalianJamaicanJapaneseJordanianKenyanKiowaKoreanLaotianLatvianLebaneseLiberianLithuanianLumbeeLuxembourgerMacedonianMalaysianMalteseMarshalleseMenomineeMexicanMexican American IndianMongolianMoroccanNative HawaiianNavajoNepaleseNew ZealanderNicaraguanNigerianNorthern EuropeanNorwegianOkinawanOsageOttawaPaiutePakistaniPalestinianPanamanianParaguayanPennsylvania GermanPeruvianPimaPolishPortuguesePotawatomiPuebloPuerto RicanPuget Sound SalishRomanianRussianSalvadoranSamoanScandinavianScotch-IrishScottishSeminoleSenegaleseSerbianShoshoneSierra LeoneanSiouxSlavicSlovakSloveneSomaliSouth AfricanSouth AmericanSouth American IndianSoviet UnionSpaniardSpanishSpanish AmericanSpanish American IndianSri LankanSubsaharan AfricanSudaneseSwedishSwissSyrianTaiwaneseThaiTlingit-HaidaTohono O'OdhamTonganTrinidadian and TobagonianTsimshianTurkishU.S. Virgin IslanderUgandanUkrainianUruguayanUteVenezuelanVietnameseWelshWest IndianYakamaYaquiYugoslavianYumanYup'ikZimbabwean
Immigration
NonimmigrantsImmigrantsAfghanistanAfricaArgentinaArmeniaAsiaAustraliaAustriaBahamasBangladeshBarbadosBelarusBelgiumBelizeBoliviaBosnia and HerzegovinaBrazilBulgariaBurma/MyanmarCabo VerdeCambodiaCameroonCanadaCaribbeanCentral AmericaChileChinaColombiaCongoCosta RicaCroatiaCubaCzechoslovakiaDenmarkDominicaDominican RepublicEastern AfricaEastern AsiaEastern EuropeEcuadorEgyptEl SalvadorEnglandEritreaEthiopiaEuropeFijiFranceGermanyGhanaGreeceGrenadaGuatemalaGuyanaHaitiHondurasHong KongHungaryIndiaIndonesiaIranIraqIrelandIsraelItalyJamaicaJapanJordanKazakhstanKenyaKoreaKuwaitLaosLatin AmericaLatviaLebanonLiberiaLithuaniaMalaysiaMexicoMicronesiaMiddle AfricaMoldovaMoroccoNepalNetherlandsNicaraguaNigeriaNorth AmericaNorth MacedoniaNorthern AfricaNorthern EuropeNorwayOceaniaPakistanPanamaPeruPhilippinesPolandPortugalRomaniaRussiaSaudi ArabiaScotlandSenegalSerbiaSierra LeoneSingaporeSomaliaSouth AfricaSouth AmericaSouth Central AsiaSouth Eastern AsiaSouthern EuropeSpainSri LankaSt. Vincent and the GrenadinesSudanSwedenSwitzerlandSyriaTaiwanThailandTrinidad and TobagoTurkeyUgandaUkraineUruguayUzbekistanVenezuelaVietnamWest IndiesWestern AfricaWestern AsiaWestern EuropeYemenZaireZimbabweAzores
Unemployment Among Youth under 25 years
Income
Poverty
Unemployment
Labor Participation
Family Structure
Vehicle Availability
Education Level
Disability

Unemployment Among Youth under 25 years Comparison

Immigrants from Albania

Turks

Tragic
Excellent
12.1%
UNEMPLOYMENT AMONG YOUTH UNDER 25 YEARS
1.1/ 100
METRIC RATING
241st/ 347
METRIC RANK
11.4%
UNEMPLOYMENT AMONG YOUTH UNDER 25 YEARS
85.8/ 100
METRIC RATING
129th/ 347
METRIC RANK

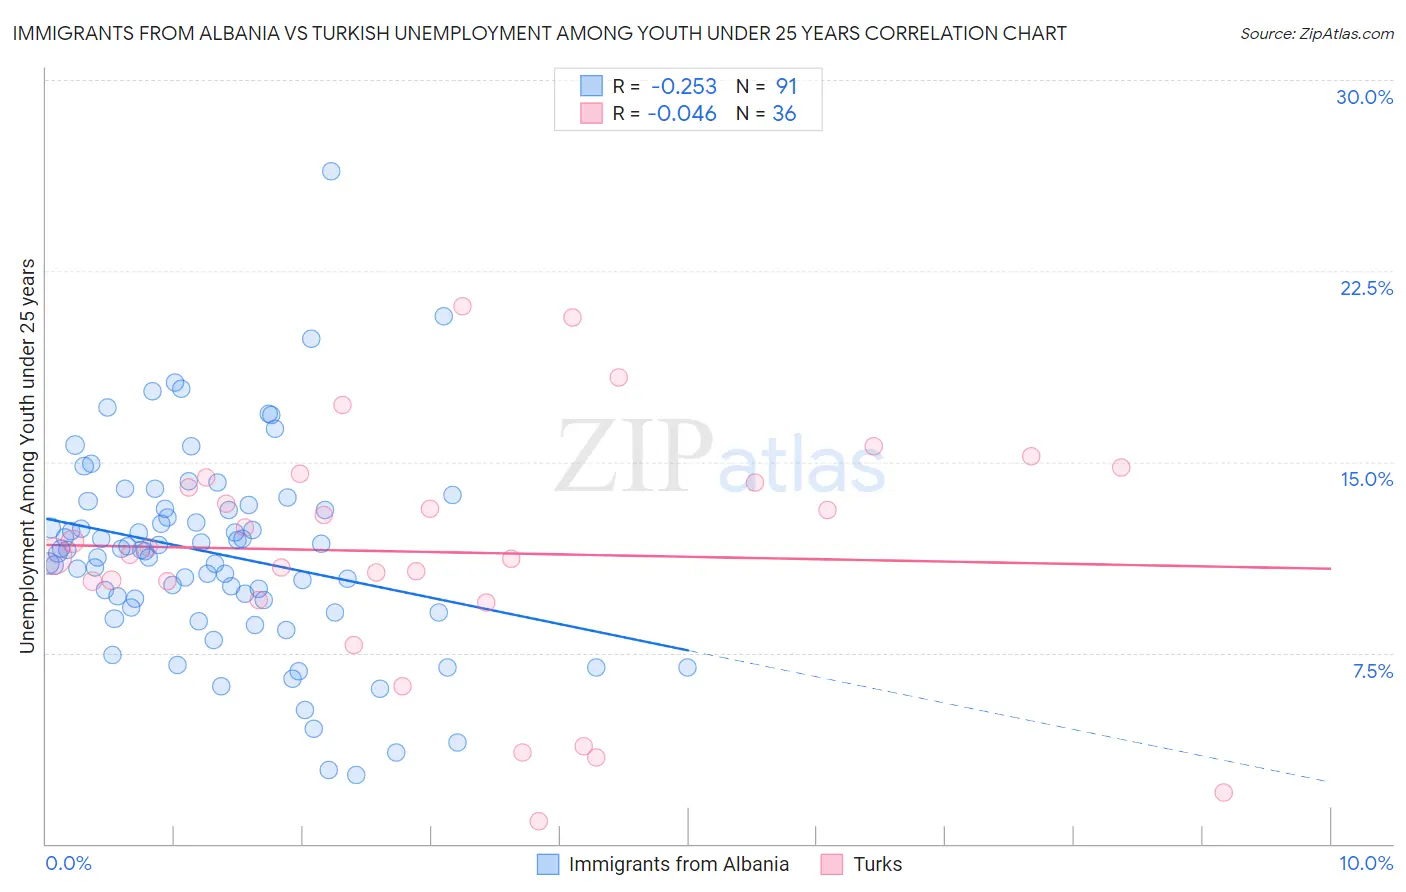
Immigrants from Albania vs Turkish Unemployment Among Youth under 25 years Correlation Chart

The statistical analysis conducted on geographies consisting of 118,834,008 people shows a weak negative correlation between the proportion of Immigrants from Albania and unemployment rate among youth under the age of 25 in the United States with a correlation coefficient (R) of -0.253 and weighted average of 12.1%. Similarly, the statistical analysis conducted on geographies consisting of 269,922,235 people shows no correlation between the proportion of Turks and unemployment rate among youth under the age of 25 in the United States with a correlation coefficient (R) of -0.046 and weighted average of 11.4%, a difference of 6.6%.
Immigrants from Albania vs Turkish Unemployment Among Youth under 25 years

Unemployment Among Youth under 25 years Correlation Summary

MeasurementImmigrants from AlbaniaTurkish
Minimum2.7%0.90%
Maximum26.4%21.1%
Range23.7%20.2%
Mean11.4%11.5%
Median11.5%11.5%
Interquartile 25% (IQ1)9.3%9.9%
Interquartile 75% (IQ3)13.2%14.3%
Interquartile Range (IQR)3.9%4.4%
Standard Deviation (Sample)3.9%4.7%
Standard Deviation (Population)3.9%4.7%

Similar Demographics by Unemployment Among Youth under 25 years

Demographics Similar to Immigrants from Albania by Unemployment Among Youth under 25 years

In terms of unemployment among youth under 25 years, the demographic groups most similar to Immigrants from Albania are Dutch West Indian (12.1%, a difference of 0.020%), Immigrants from Africa (12.1%, a difference of 0.050%), Albanian (12.1%, a difference of 0.10%), Native Hawaiian (12.1%, a difference of 0.17%), and Immigrants (12.1%, a difference of 0.19%).
DemographicsRating | RankUnemployment Among Youth under 25 years
Guatemalans
1.4
/100
|
#234
Tragic
12.1%
Immigrants | Guatemala
1.4
/100
|
#235
Tragic
12.1%
Immigrants | Immigrants
1.3
/100
|
#236
Tragic
12.1%
Native Hawaiians
1.3
/100
|
#237
Tragic
12.1%
Albanians
1.2
/100
|
#238
Tragic
12.1%
Immigrants | Africa
1.1
/100
|
#239
Tragic
12.1%
Dutch West Indians
1.1
/100
|
#240
Tragic
12.1%
Immigrants | Albania
1.1
/100
|
#241
Tragic
12.1%
Immigrants | Western Asia
0.8
/100
|
#242
Tragic
12.2%
Immigrants | Azores
0.6
/100
|
#243
Tragic
12.2%
Alaskan Athabascans
0.6
/100
|
#244
Tragic
12.2%
Spanish Americans
0.6
/100
|
#245
Tragic
12.2%
Immigrants | Honduras
0.6
/100
|
#246
Tragic
12.2%
Immigrants | Greece
0.6
/100
|
#247
Tragic
12.2%
Central Americans
0.6
/100
|
#248
Tragic
12.2%

Demographics Similar to Turks by Unemployment Among Youth under 25 years

In terms of unemployment among youth under 25 years, the demographic groups most similar to Turks are Hungarian (11.4%, a difference of 0.010%), Immigrants from Hungary (11.4%, a difference of 0.020%), Greek (11.4%, a difference of 0.030%), Canadian (11.4%, a difference of 0.070%), and Immigrants from Spain (11.4%, a difference of 0.10%).
DemographicsRating | RankUnemployment Among Youth under 25 years
Immigrants | Micronesia
88.1
/100
|
#122
Excellent
11.4%
Basques
87.8
/100
|
#123
Excellent
11.4%
Italians
87.2
/100
|
#124
Excellent
11.4%
Immigrants | Argentina
87.2
/100
|
#125
Excellent
11.4%
Canadians
86.6
/100
|
#126
Excellent
11.4%
Greeks
86.2
/100
|
#127
Excellent
11.4%
Immigrants | Hungary
86.0
/100
|
#128
Excellent
11.4%
Turks
85.8
/100
|
#129
Excellent
11.4%
Hungarians
85.7
/100
|
#130
Excellent
11.4%
Immigrants | Spain
84.6
/100
|
#131
Excellent
11.4%
Ethiopians
83.2
/100
|
#132
Excellent
11.4%
Lebanese
83.1
/100
|
#133
Excellent
11.4%
Immigrants | Chile
80.4
/100
|
#134
Excellent
11.4%
Immigrants | Oceania
80.2
/100
|
#135
Excellent
11.4%
Romanians
80.1
/100
|
#136
Excellent
11.4%