Immigrants from Uzbekistan vs Yaqui Unemployment Among Youth under 25 years
COMPARE
Immigrants from Uzbekistan
Yaqui
Unemployment Among Youth under 25 years
Unemployment Among Youth under 25 years Comparison
Immigrants from Uzbekistan
Yaqui
13.1%
UNEMPLOYMENT AMONG YOUTH UNDER 25 YEARS
0.0/ 100
METRIC RATING
276th/ 347
METRIC RANK
11.9%
UNEMPLOYMENT AMONG YOUTH UNDER 25 YEARS
6.9/ 100
METRIC RATING
217th/ 347
METRIC RANK
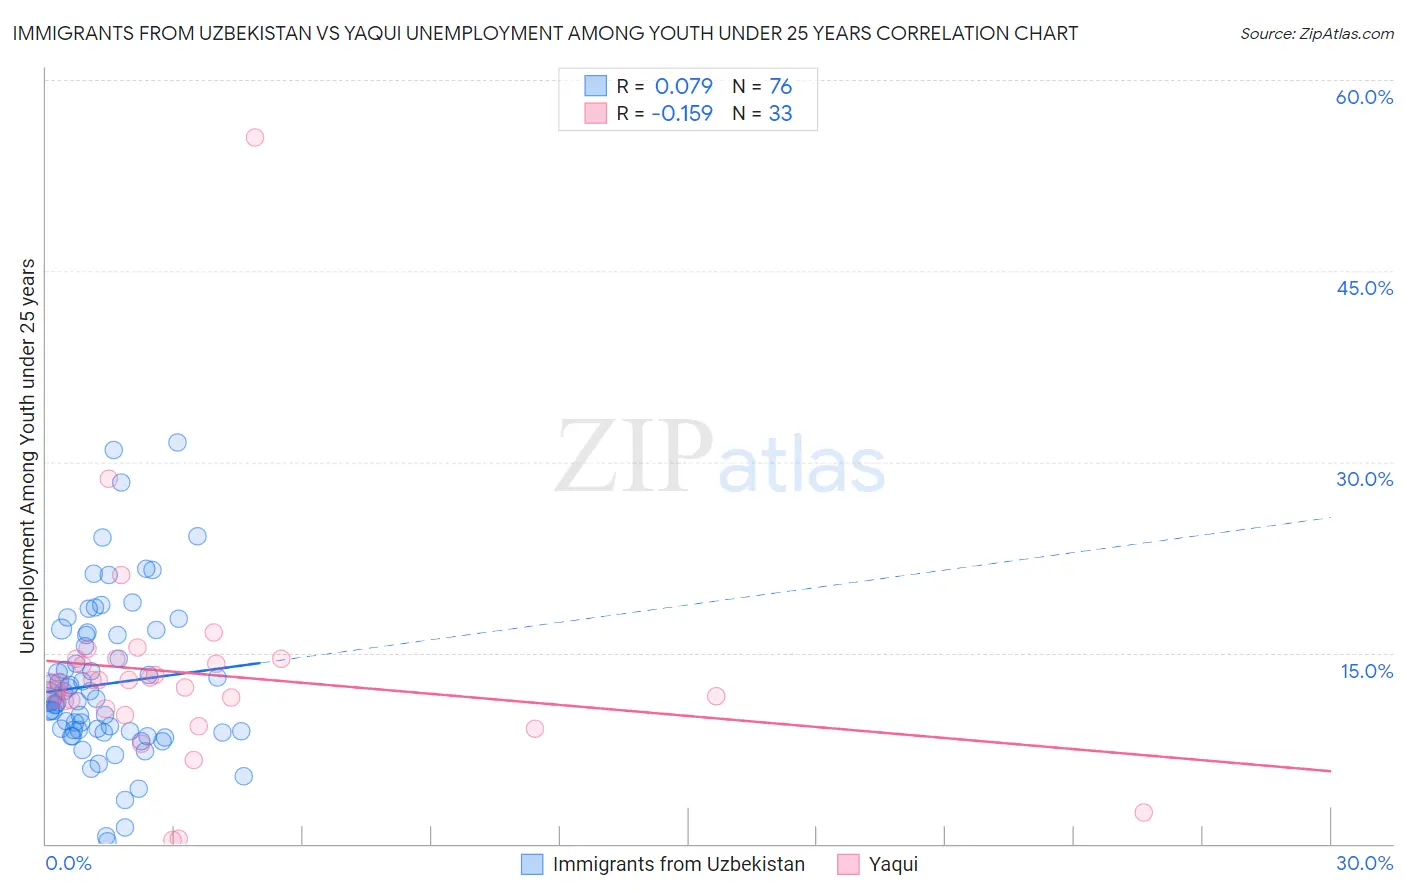
Immigrants from Uzbekistan vs Yaqui Unemployment Among Youth under 25 years Correlation Chart
The statistical analysis conducted on geographies consisting of 118,349,257 people shows a slight positive correlation between the proportion of Immigrants from Uzbekistan and unemployment rate among youth under the age of 25 in the United States with a correlation coefficient (R) of 0.079 and weighted average of 13.1%. Similarly, the statistical analysis conducted on geographies consisting of 107,339,892 people shows a poor negative correlation between the proportion of Yaqui and unemployment rate among youth under the age of 25 in the United States with a correlation coefficient (R) of -0.159 and weighted average of 11.9%, a difference of 10.0%.
Unemployment Among Youth under 25 years Correlation Summary
| Measurement | Immigrants from Uzbekistan | Yaqui |
| Minimum | 0.20% | 0.30% |
| Maximum | 31.5% | 55.5% |
| Range | 31.3% | 55.2% |
| Mean | 12.5% | 13.3% |
| Median | 11.3% | 12.6% |
| Interquartile 25% (IQ1) | 8.7% | 10.4% |
| Interquartile 75% (IQ3) | 16.4% | 14.5% |
| Interquartile Range (IQR) | 7.6% | 4.1% |
| Standard Deviation (Sample) | 6.2% | 9.2% |
| Standard Deviation (Population) | 6.2% | 9.0% |
Similar Demographics by Unemployment Among Youth under 25 years
Demographics Similar to Immigrants from Uzbekistan by Unemployment Among Youth under 25 years
In terms of unemployment among youth under 25 years, the demographic groups most similar to Immigrants from Uzbekistan are Bahamian (13.1%, a difference of 0.17%), African (13.2%, a difference of 0.42%), Bermudan (13.0%, a difference of 0.43%), Immigrants from Nigeria (13.0%, a difference of 0.54%), and Cajun (13.2%, a difference of 1.1%).
| Demographics | Rating | Rank | Unemployment Among Youth under 25 years |
| Kiowa | 0.0 /100 | #269 | Tragic 12.7% |
| Immigrants | Liberia | 0.0 /100 | #270 | Tragic 12.8% |
| Immigrants | Bahamas | 0.0 /100 | #271 | Tragic 12.9% |
| Cape Verdeans | 0.0 /100 | #272 | Tragic 12.9% |
| Nigerians | 0.0 /100 | #273 | Tragic 13.0% |
| Immigrants | Nigeria | 0.0 /100 | #274 | Tragic 13.0% |
| Bermudans | 0.0 /100 | #275 | Tragic 13.0% |
| Immigrants | Uzbekistan | 0.0 /100 | #276 | Tragic 13.1% |
| Bahamians | 0.0 /100 | #277 | Tragic 13.1% |
| Africans | 0.0 /100 | #278 | Tragic 13.2% |
| Cajuns | 0.0 /100 | #279 | Tragic 13.2% |
| Ute | 0.0 /100 | #280 | Tragic 13.3% |
| Armenians | 0.0 /100 | #281 | Tragic 13.3% |
| Sierra Leoneans | 0.0 /100 | #282 | Tragic 13.3% |
| Immigrants | Cameroon | 0.0 /100 | #283 | Tragic 13.3% |
Demographics Similar to Yaqui by Unemployment Among Youth under 25 years
In terms of unemployment among youth under 25 years, the demographic groups most similar to Yaqui are Guamanian/Chamorro (11.9%, a difference of 0.010%), Immigrants from Middle Africa (11.9%, a difference of 0.010%), Samoan (11.9%, a difference of 0.070%), Nonimmigrants (11.9%, a difference of 0.12%), and Alsatian (11.9%, a difference of 0.14%).
| Demographics | Rating | Rank | Unemployment Among Youth under 25 years |
| Assyrians/Chaldeans/Syriacs | 9.8 /100 | #210 | Tragic 11.9% |
| Immigrants | Philippines | 9.2 /100 | #211 | Tragic 11.9% |
| Colombians | 9.1 /100 | #212 | Tragic 11.9% |
| South Americans | 8.5 /100 | #213 | Tragic 11.9% |
| Costa Ricans | 8.2 /100 | #214 | Tragic 11.9% |
| Samoans | 7.4 /100 | #215 | Tragic 11.9% |
| Guamanians/Chamorros | 7.0 /100 | #216 | Tragic 11.9% |
| Yaqui | 6.9 /100 | #217 | Tragic 11.9% |
| Immigrants | Middle Africa | 6.8 /100 | #218 | Tragic 11.9% |
| Immigrants | Nonimmigrants | 6.2 /100 | #219 | Tragic 11.9% |
| Alsatians | 6.1 /100 | #220 | Tragic 11.9% |
| Immigrants | Portugal | 4.9 /100 | #221 | Tragic 12.0% |
| Israelis | 4.1 /100 | #222 | Tragic 12.0% |
| Immigrants | Ireland | 3.5 /100 | #223 | Tragic 12.0% |
| Hawaiians | 3.5 /100 | #224 | Tragic 12.0% |