Immigrants from Uzbekistan vs Immigrants from Ireland Unemployment Among Youth under 25 years
COMPARE
Immigrants from Uzbekistan
Immigrants from Ireland
Unemployment Among Youth under 25 years
Unemployment Among Youth under 25 years Comparison
Immigrants from Uzbekistan
Immigrants from Ireland
13.1%
UNEMPLOYMENT AMONG YOUTH UNDER 25 YEARS
0.0/ 100
METRIC RATING
276th/ 347
METRIC RANK
12.0%
UNEMPLOYMENT AMONG YOUTH UNDER 25 YEARS
3.5/ 100
METRIC RATING
223rd/ 347
METRIC RANK
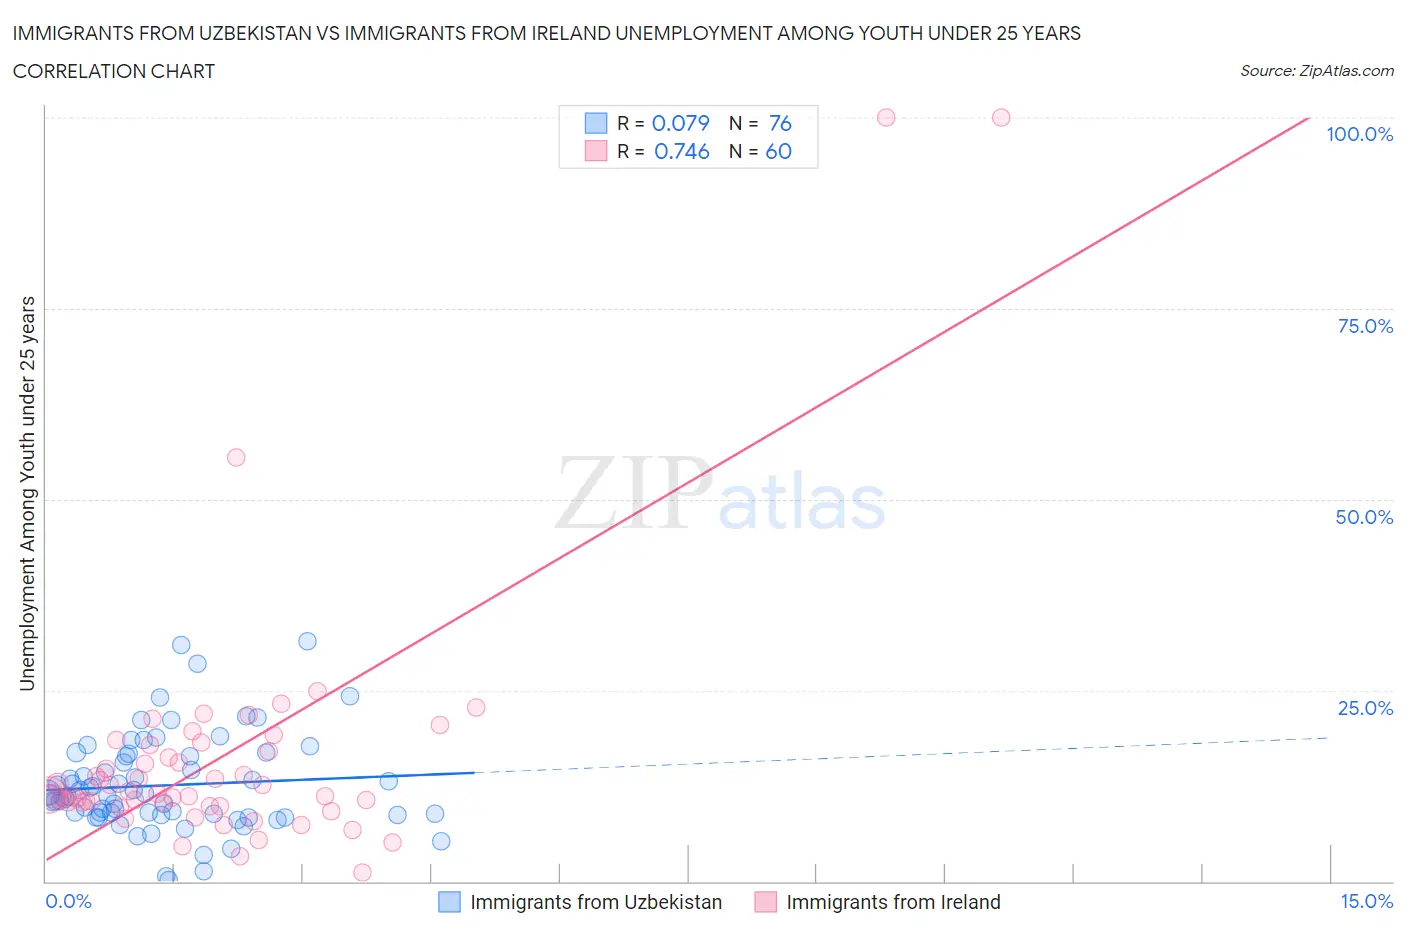
Immigrants from Uzbekistan vs Immigrants from Ireland Unemployment Among Youth under 25 years Correlation Chart
The statistical analysis conducted on geographies consisting of 118,349,257 people shows a slight positive correlation between the proportion of Immigrants from Uzbekistan and unemployment rate among youth under the age of 25 in the United States with a correlation coefficient (R) of 0.079 and weighted average of 13.1%. Similarly, the statistical analysis conducted on geographies consisting of 238,594,330 people shows a strong positive correlation between the proportion of Immigrants from Ireland and unemployment rate among youth under the age of 25 in the United States with a correlation coefficient (R) of 0.746 and weighted average of 12.0%, a difference of 9.2%.
Unemployment Among Youth under 25 years Correlation Summary
| Measurement | Immigrants from Uzbekistan | Immigrants from Ireland |
| Minimum | 0.20% | 1.2% |
| Maximum | 31.5% | 100.0% |
| Range | 31.3% | 98.8% |
| Mean | 12.5% | 16.3% |
| Median | 11.3% | 11.4% |
| Interquartile 25% (IQ1) | 8.7% | 10.1% |
| Interquartile 75% (IQ3) | 16.4% | 17.5% |
| Interquartile Range (IQR) | 7.6% | 7.4% |
| Standard Deviation (Sample) | 6.2% | 17.4% |
| Standard Deviation (Population) | 6.2% | 17.2% |
Similar Demographics by Unemployment Among Youth under 25 years
Demographics Similar to Immigrants from Uzbekistan by Unemployment Among Youth under 25 years
In terms of unemployment among youth under 25 years, the demographic groups most similar to Immigrants from Uzbekistan are Bahamian (13.1%, a difference of 0.17%), African (13.2%, a difference of 0.42%), Bermudan (13.0%, a difference of 0.43%), Immigrants from Nigeria (13.0%, a difference of 0.54%), and Cajun (13.2%, a difference of 1.1%).
| Demographics | Rating | Rank | Unemployment Among Youth under 25 years |
| Kiowa | 0.0 /100 | #269 | Tragic 12.7% |
| Immigrants | Liberia | 0.0 /100 | #270 | Tragic 12.8% |
| Immigrants | Bahamas | 0.0 /100 | #271 | Tragic 12.9% |
| Cape Verdeans | 0.0 /100 | #272 | Tragic 12.9% |
| Nigerians | 0.0 /100 | #273 | Tragic 13.0% |
| Immigrants | Nigeria | 0.0 /100 | #274 | Tragic 13.0% |
| Bermudans | 0.0 /100 | #275 | Tragic 13.0% |
| Immigrants | Uzbekistan | 0.0 /100 | #276 | Tragic 13.1% |
| Bahamians | 0.0 /100 | #277 | Tragic 13.1% |
| Africans | 0.0 /100 | #278 | Tragic 13.2% |
| Cajuns | 0.0 /100 | #279 | Tragic 13.2% |
| Ute | 0.0 /100 | #280 | Tragic 13.3% |
| Armenians | 0.0 /100 | #281 | Tragic 13.3% |
| Sierra Leoneans | 0.0 /100 | #282 | Tragic 13.3% |
| Immigrants | Cameroon | 0.0 /100 | #283 | Tragic 13.3% |
Demographics Similar to Immigrants from Ireland by Unemployment Among Youth under 25 years
In terms of unemployment among youth under 25 years, the demographic groups most similar to Immigrants from Ireland are Hawaiian (12.0%, a difference of 0.010%), Israeli (12.0%, a difference of 0.15%), Immigrants from Ukraine (12.0%, a difference of 0.16%), Immigrants from Israel (12.0%, a difference of 0.30%), and Immigrants from Iran (12.0%, a difference of 0.32%).
| Demographics | Rating | Rank | Unemployment Among Youth under 25 years |
| Guamanians/Chamorros | 7.0 /100 | #216 | Tragic 11.9% |
| Yaqui | 6.9 /100 | #217 | Tragic 11.9% |
| Immigrants | Middle Africa | 6.8 /100 | #218 | Tragic 11.9% |
| Immigrants | Nonimmigrants | 6.2 /100 | #219 | Tragic 11.9% |
| Alsatians | 6.1 /100 | #220 | Tragic 11.9% |
| Immigrants | Portugal | 4.9 /100 | #221 | Tragic 12.0% |
| Israelis | 4.1 /100 | #222 | Tragic 12.0% |
| Immigrants | Ireland | 3.5 /100 | #223 | Tragic 12.0% |
| Hawaiians | 3.5 /100 | #224 | Tragic 12.0% |
| Immigrants | Ukraine | 3.0 /100 | #225 | Tragic 12.0% |
| Immigrants | Israel | 2.6 /100 | #226 | Tragic 12.0% |
| Immigrants | Iran | 2.6 /100 | #227 | Tragic 12.0% |
| Immigrants | Fiji | 2.1 /100 | #228 | Tragic 12.1% |
| Moroccans | 2.1 /100 | #229 | Tragic 12.1% |
| Choctaw | 1.9 /100 | #230 | Tragic 12.1% |