Immigrants from Western Asia vs Australian Male Unemployment
COMPARE
Immigrants from Western Asia
Australian
Male Unemployment
Male Unemployment Comparison
Immigrants from Western Asia
Australians
5.6%
MALE UNEMPLOYMENT
3.5/ 100
METRIC RATING
219th/ 347
METRIC RANK
5.0%
MALE UNEMPLOYMENT
97.4/ 100
METRIC RATING
68th/ 347
METRIC RANK
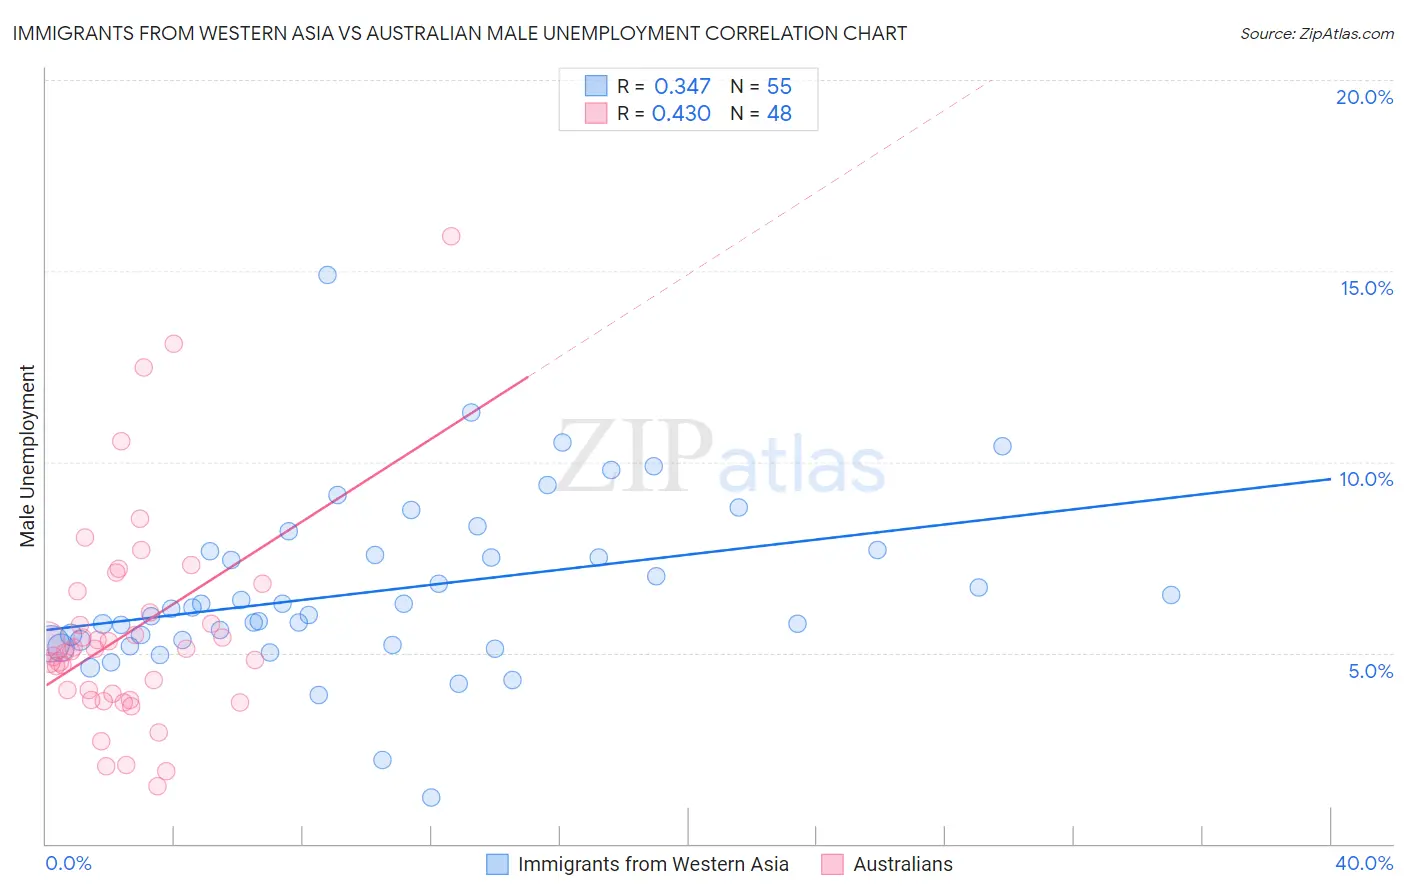
Immigrants from Western Asia vs Australian Male Unemployment Correlation Chart
The statistical analysis conducted on geographies consisting of 403,036,222 people shows a mild positive correlation between the proportion of Immigrants from Western Asia and unemployment rate among males in the United States with a correlation coefficient (R) of 0.347 and weighted average of 5.6%. Similarly, the statistical analysis conducted on geographies consisting of 223,647,847 people shows a moderate positive correlation between the proportion of Australians and unemployment rate among males in the United States with a correlation coefficient (R) of 0.430 and weighted average of 5.0%, a difference of 10.7%.
Male Unemployment Correlation Summary
| Measurement | Immigrants from Western Asia | Australian |
| Minimum | 1.2% | 1.5% |
| Maximum | 14.9% | 15.9% |
| Range | 13.7% | 14.4% |
| Mean | 6.6% | 5.6% |
| Median | 6.1% | 5.1% |
| Interquartile 25% (IQ1) | 5.2% | 3.8% |
| Interquartile 75% (IQ3) | 7.6% | 6.3% |
| Interquartile Range (IQR) | 2.4% | 2.5% |
| Standard Deviation (Sample) | 2.3% | 2.8% |
| Standard Deviation (Population) | 2.3% | 2.8% |
Similar Demographics by Male Unemployment
Demographics Similar to Immigrants from Western Asia by Male Unemployment
In terms of male unemployment, the demographic groups most similar to Immigrants from Western Asia are Portuguese (5.6%, a difference of 0.030%), Immigrants from Albania (5.5%, a difference of 0.050%), Soviet Union (5.6%, a difference of 0.13%), Delaware (5.5%, a difference of 0.25%), and Immigrants from Micronesia (5.6%, a difference of 0.27%).
| Demographics | Rating | Rank | Male Unemployment |
| Hmong | 7.0 /100 | #212 | Tragic 5.5% |
| Ugandans | 6.3 /100 | #213 | Tragic 5.5% |
| Puget Sound Salish | 5.6 /100 | #214 | Tragic 5.5% |
| Samoans | 4.9 /100 | #215 | Tragic 5.5% |
| Immigrants | Immigrants | 4.3 /100 | #216 | Tragic 5.5% |
| Delaware | 4.2 /100 | #217 | Tragic 5.5% |
| Immigrants | Albania | 3.6 /100 | #218 | Tragic 5.5% |
| Immigrants | Western Asia | 3.5 /100 | #219 | Tragic 5.6% |
| Portuguese | 3.5 /100 | #220 | Tragic 5.6% |
| Soviet Union | 3.2 /100 | #221 | Tragic 5.6% |
| Immigrants | Micronesia | 2.9 /100 | #222 | Tragic 5.6% |
| Creek | 2.6 /100 | #223 | Tragic 5.6% |
| Cherokee | 2.4 /100 | #224 | Tragic 5.6% |
| Panamanians | 1.9 /100 | #225 | Tragic 5.6% |
| Immigrants | Cambodia | 1.8 /100 | #226 | Tragic 5.6% |
Demographics Similar to Australians by Male Unemployment
In terms of male unemployment, the demographic groups most similar to Australians are Immigrants from Canada (5.0%, a difference of 0.010%), Finnish (5.0%, a difference of 0.030%), Immigrants from Sweden (5.0%, a difference of 0.030%), White/Caucasian (5.0%, a difference of 0.080%), and New Zealander (5.0%, a difference of 0.10%).
| Demographics | Rating | Rank | Male Unemployment |
| Cambodians | 98.1 /100 | #61 | Exceptional 5.0% |
| Basques | 97.9 /100 | #62 | Exceptional 5.0% |
| Eastern Europeans | 97.9 /100 | #63 | Exceptional 5.0% |
| Celtics | 97.8 /100 | #64 | Exceptional 5.0% |
| Icelanders | 97.6 /100 | #65 | Exceptional 5.0% |
| Finns | 97.5 /100 | #66 | Exceptional 5.0% |
| Immigrants | Canada | 97.5 /100 | #67 | Exceptional 5.0% |
| Australians | 97.4 /100 | #68 | Exceptional 5.0% |
| Immigrants | Sweden | 97.4 /100 | #69 | Exceptional 5.0% |
| Whites/Caucasians | 97.3 /100 | #70 | Exceptional 5.0% |
| New Zealanders | 97.3 /100 | #71 | Exceptional 5.0% |
| Immigrants | South Africa | 97.1 /100 | #72 | Exceptional 5.0% |
| Greeks | 97.0 /100 | #73 | Exceptional 5.0% |
| Immigrants | North America | 96.9 /100 | #74 | Exceptional 5.0% |
| Assyrians/Chaldeans/Syriacs | 96.9 /100 | #75 | Exceptional 5.0% |