Moroccan vs Immigrants from Ethiopia Unemployment Among Ages 60 to 64 years
COMPARE
Moroccan
Immigrants from Ethiopia
Unemployment Among Ages 60 to 64 years
Unemployment Among Ages 60 to 64 years Comparison
Moroccans
Immigrants from Ethiopia
4.9%
UNEMPLOYMENT AMONG AGES 60 TO 64 YEARS
15.0/ 100
METRIC RATING
212th/ 347
METRIC RANK
4.8%
UNEMPLOYMENT AMONG AGES 60 TO 64 YEARS
85.3/ 100
METRIC RATING
142nd/ 347
METRIC RANK
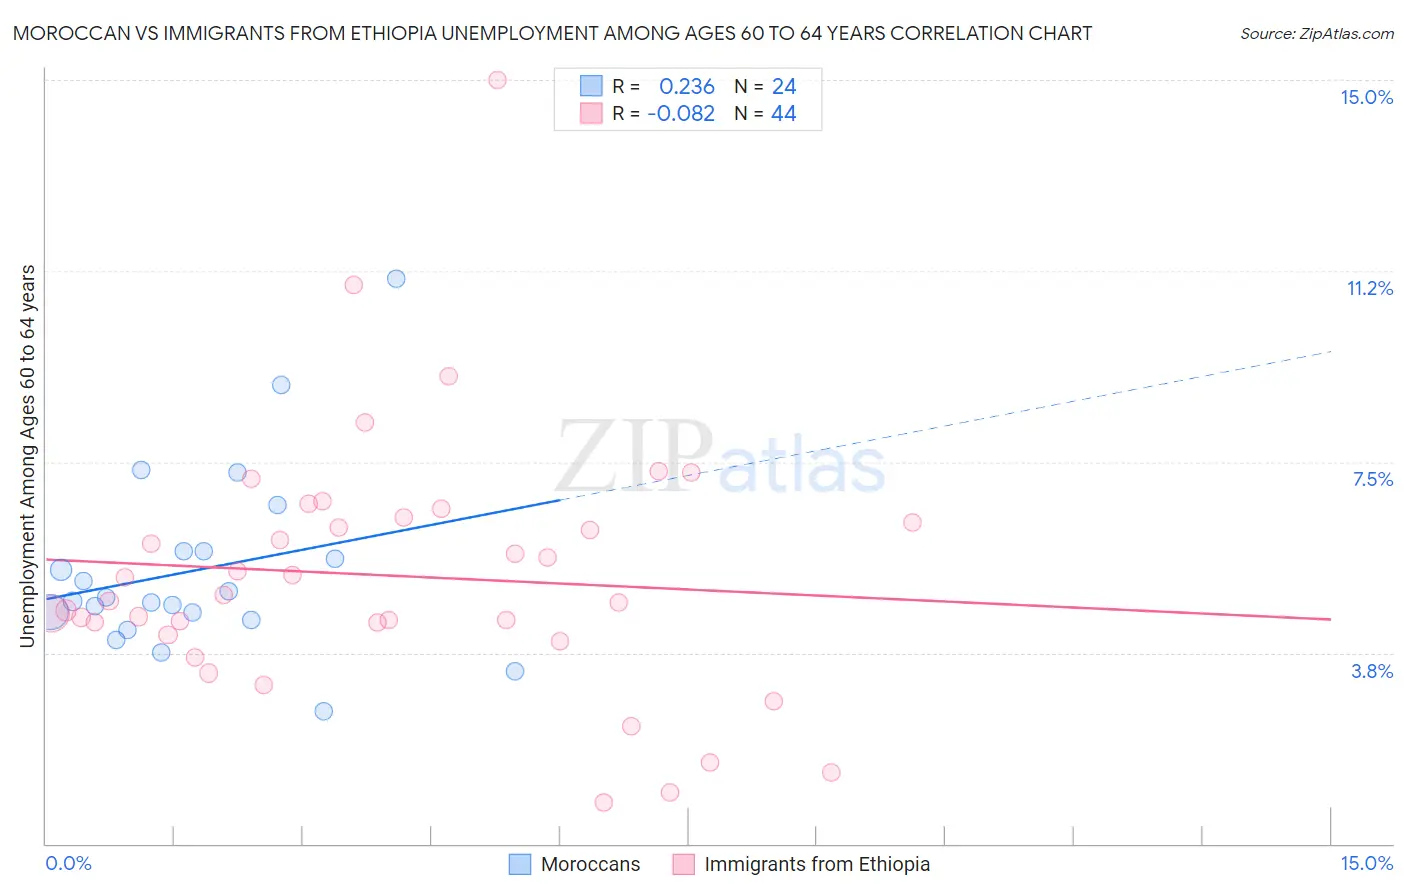
Moroccan vs Immigrants from Ethiopia Unemployment Among Ages 60 to 64 years Correlation Chart
The statistical analysis conducted on geographies consisting of 192,149,993 people shows a weak positive correlation between the proportion of Moroccans and unemployment rate among population between the ages 60 and 64 in the United States with a correlation coefficient (R) of 0.236 and weighted average of 4.9%. Similarly, the statistical analysis conducted on geographies consisting of 200,053,248 people shows a slight negative correlation between the proportion of Immigrants from Ethiopia and unemployment rate among population between the ages 60 and 64 in the United States with a correlation coefficient (R) of -0.082 and weighted average of 4.8%, a difference of 3.1%.
Unemployment Among Ages 60 to 64 years Correlation Summary
| Measurement | Moroccan | Immigrants from Ethiopia |
| Minimum | 2.6% | 0.80% |
| Maximum | 11.1% | 15.0% |
| Range | 8.5% | 14.2% |
| Mean | 5.4% | 5.3% |
| Median | 4.8% | 4.8% |
| Interquartile 25% (IQ1) | 4.5% | 4.2% |
| Interquartile 75% (IQ3) | 5.7% | 6.4% |
| Interquartile Range (IQR) | 1.3% | 2.1% |
| Standard Deviation (Sample) | 1.8% | 2.5% |
| Standard Deviation (Population) | 1.8% | 2.5% |
Similar Demographics by Unemployment Among Ages 60 to 64 years
Demographics Similar to Moroccans by Unemployment Among Ages 60 to 64 years
In terms of unemployment among ages 60 to 64 years, the demographic groups most similar to Moroccans are Blackfeet (4.9%, a difference of 0.050%), Eastern European (4.9%, a difference of 0.050%), Cherokee (4.9%, a difference of 0.070%), Immigrants from Russia (4.9%, a difference of 0.090%), and Sierra Leonean (4.9%, a difference of 0.10%).
| Demographics | Rating | Rank | Unemployment Among Ages 60 to 64 years |
| Immigrants | Indonesia | 17.4 /100 | #205 | Poor 4.9% |
| New Zealanders | 17.4 /100 | #206 | Poor 4.9% |
| Chippewa | 17.3 /100 | #207 | Poor 4.9% |
| German Russians | 16.8 /100 | #208 | Poor 4.9% |
| Sierra Leoneans | 16.5 /100 | #209 | Poor 4.9% |
| Cherokee | 16.1 /100 | #210 | Poor 4.9% |
| Blackfeet | 15.7 /100 | #211 | Poor 4.9% |
| Moroccans | 15.0 /100 | #212 | Poor 4.9% |
| Eastern Europeans | 14.3 /100 | #213 | Poor 4.9% |
| Immigrants | Russia | 13.7 /100 | #214 | Poor 4.9% |
| Immigrants | South Eastern Asia | 13.1 /100 | #215 | Poor 4.9% |
| Cajuns | 12.3 /100 | #216 | Poor 4.9% |
| Koreans | 12.2 /100 | #217 | Poor 4.9% |
| Immigrants | Singapore | 12.0 /100 | #218 | Poor 4.9% |
| Immigrants | Brazil | 11.7 /100 | #219 | Poor 4.9% |
Demographics Similar to Immigrants from Ethiopia by Unemployment Among Ages 60 to 64 years
In terms of unemployment among ages 60 to 64 years, the demographic groups most similar to Immigrants from Ethiopia are Panamanian (4.8%, a difference of 0.010%), Italian (4.8%, a difference of 0.020%), Pima (4.8%, a difference of 0.030%), Immigrants from Lithuania (4.8%, a difference of 0.10%), and Immigrants from Africa (4.8%, a difference of 0.10%).
| Demographics | Rating | Rank | Unemployment Among Ages 60 to 64 years |
| Pennsylvania Germans | 87.8 /100 | #135 | Excellent 4.8% |
| French Canadians | 87.6 /100 | #136 | Excellent 4.8% |
| Cambodians | 86.9 /100 | #137 | Excellent 4.8% |
| Immigrants | Lithuania | 86.7 /100 | #138 | Excellent 4.8% |
| Immigrants | Africa | 86.6 /100 | #139 | Excellent 4.8% |
| Pima | 85.8 /100 | #140 | Excellent 4.8% |
| Panamanians | 85.5 /100 | #141 | Excellent 4.8% |
| Immigrants | Ethiopia | 85.3 /100 | #142 | Excellent 4.8% |
| Italians | 85.0 /100 | #143 | Excellent 4.8% |
| Immigrants | Pakistan | 83.3 /100 | #144 | Excellent 4.8% |
| Burmese | 83.1 /100 | #145 | Excellent 4.8% |
| Turks | 81.9 /100 | #146 | Excellent 4.8% |
| Mongolians | 81.2 /100 | #147 | Excellent 4.8% |
| Latvians | 79.1 /100 | #148 | Good 4.8% |
| Arabs | 78.8 /100 | #149 | Good 4.8% |