Belgian vs Immigrants from Ethiopia Unemployment Among Ages 60 to 64 years
COMPARE
Belgian
Immigrants from Ethiopia
Unemployment Among Ages 60 to 64 years
Unemployment Among Ages 60 to 64 years Comparison
Belgians
Immigrants from Ethiopia
4.5%
UNEMPLOYMENT AMONG AGES 60 TO 64 YEARS
100.0/ 100
METRIC RATING
34th/ 347
METRIC RANK
4.8%
UNEMPLOYMENT AMONG AGES 60 TO 64 YEARS
85.3/ 100
METRIC RATING
142nd/ 347
METRIC RANK
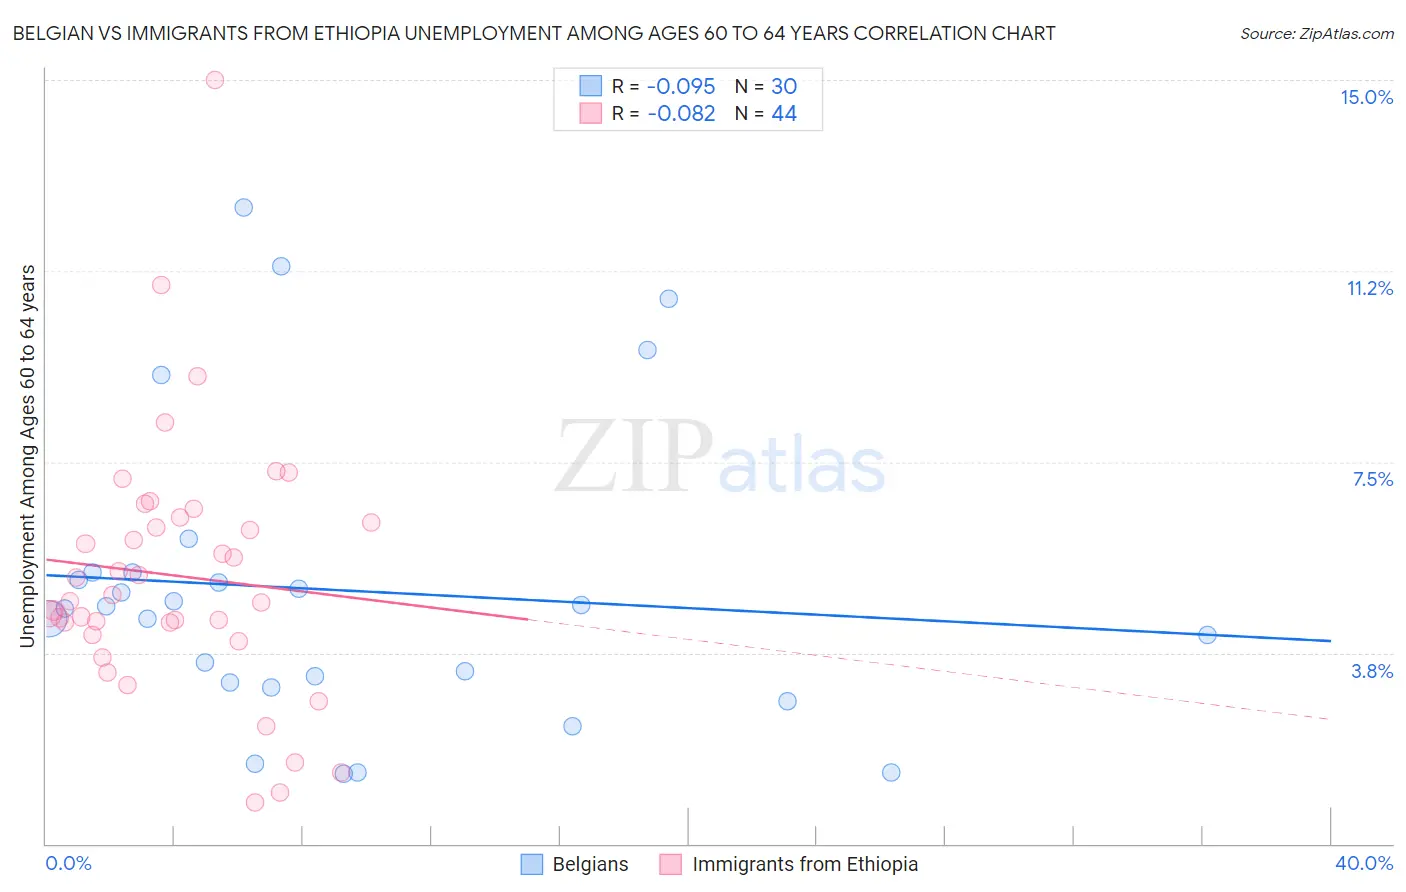
Belgian vs Immigrants from Ethiopia Unemployment Among Ages 60 to 64 years Correlation Chart
The statistical analysis conducted on geographies consisting of 318,582,400 people shows a slight negative correlation between the proportion of Belgians and unemployment rate among population between the ages 60 and 64 in the United States with a correlation coefficient (R) of -0.095 and weighted average of 4.5%. Similarly, the statistical analysis conducted on geographies consisting of 200,053,248 people shows a slight negative correlation between the proportion of Immigrants from Ethiopia and unemployment rate among population between the ages 60 and 64 in the United States with a correlation coefficient (R) of -0.082 and weighted average of 4.8%, a difference of 6.6%.
Unemployment Among Ages 60 to 64 years Correlation Summary
| Measurement | Belgian | Immigrants from Ethiopia |
| Minimum | 1.4% | 0.80% |
| Maximum | 12.5% | 15.0% |
| Range | 11.1% | 14.2% |
| Mean | 5.0% | 5.3% |
| Median | 4.6% | 4.8% |
| Interquartile 25% (IQ1) | 3.2% | 4.2% |
| Interquartile 75% (IQ3) | 5.3% | 6.4% |
| Interquartile Range (IQR) | 2.1% | 2.1% |
| Standard Deviation (Sample) | 2.9% | 2.5% |
| Standard Deviation (Population) | 2.9% | 2.5% |
Similar Demographics by Unemployment Among Ages 60 to 64 years
Demographics Similar to Belgians by Unemployment Among Ages 60 to 64 years
In terms of unemployment among ages 60 to 64 years, the demographic groups most similar to Belgians are German (4.5%, a difference of 0.020%), Venezuelan (4.5%, a difference of 0.030%), Immigrants from Portugal (4.5%, a difference of 0.060%), Carpatho Rusyn (4.5%, a difference of 0.26%), and Native Hawaiian (4.5%, a difference of 0.26%).
| Demographics | Rating | Rank | Unemployment Among Ages 60 to 64 years |
| Immigrants | Iraq | 100.0 /100 | #27 | Exceptional 4.5% |
| Immigrants | Nepal | 100.0 /100 | #28 | Exceptional 4.5% |
| Cubans | 100.0 /100 | #29 | Exceptional 4.5% |
| Immigrants | Venezuela | 100.0 /100 | #30 | Exceptional 4.5% |
| Immigrants | Eritrea | 100.0 /100 | #31 | Exceptional 4.5% |
| Zimbabweans | 100.0 /100 | #32 | Exceptional 4.5% |
| Carpatho Rusyns | 100.0 /100 | #33 | Exceptional 4.5% |
| Belgians | 100.0 /100 | #34 | Exceptional 4.5% |
| Germans | 100.0 /100 | #35 | Exceptional 4.5% |
| Venezuelans | 100.0 /100 | #36 | Exceptional 4.5% |
| Immigrants | Portugal | 100.0 /100 | #37 | Exceptional 4.5% |
| Native Hawaiians | 100.0 /100 | #38 | Exceptional 4.5% |
| Iraqis | 100.0 /100 | #39 | Exceptional 4.5% |
| Scandinavians | 100.0 /100 | #40 | Exceptional 4.5% |
| Immigrants | Sudan | 100.0 /100 | #41 | Exceptional 4.5% |
Demographics Similar to Immigrants from Ethiopia by Unemployment Among Ages 60 to 64 years
In terms of unemployment among ages 60 to 64 years, the demographic groups most similar to Immigrants from Ethiopia are Panamanian (4.8%, a difference of 0.010%), Italian (4.8%, a difference of 0.020%), Pima (4.8%, a difference of 0.030%), Immigrants from Lithuania (4.8%, a difference of 0.10%), and Immigrants from Africa (4.8%, a difference of 0.10%).
| Demographics | Rating | Rank | Unemployment Among Ages 60 to 64 years |
| Pennsylvania Germans | 87.8 /100 | #135 | Excellent 4.8% |
| French Canadians | 87.6 /100 | #136 | Excellent 4.8% |
| Cambodians | 86.9 /100 | #137 | Excellent 4.8% |
| Immigrants | Lithuania | 86.7 /100 | #138 | Excellent 4.8% |
| Immigrants | Africa | 86.6 /100 | #139 | Excellent 4.8% |
| Pima | 85.8 /100 | #140 | Excellent 4.8% |
| Panamanians | 85.5 /100 | #141 | Excellent 4.8% |
| Immigrants | Ethiopia | 85.3 /100 | #142 | Excellent 4.8% |
| Italians | 85.0 /100 | #143 | Excellent 4.8% |
| Immigrants | Pakistan | 83.3 /100 | #144 | Excellent 4.8% |
| Burmese | 83.1 /100 | #145 | Excellent 4.8% |
| Turks | 81.9 /100 | #146 | Excellent 4.8% |
| Mongolians | 81.2 /100 | #147 | Excellent 4.8% |
| Latvians | 79.1 /100 | #148 | Good 4.8% |
| Arabs | 78.8 /100 | #149 | Good 4.8% |