Immigrants from Switzerland vs Immigrants from Guyana Male Unemployment
COMPARE
Immigrants from Switzerland
Immigrants from Guyana
Male Unemployment
Male Unemployment Comparison
Immigrants from Switzerland
Immigrants from Guyana
5.2%
MALE UNEMPLOYMENT
79.2/ 100
METRIC RATING
141st/ 347
METRIC RANK
7.1%
MALE UNEMPLOYMENT
0.0/ 100
METRIC RATING
316th/ 347
METRIC RANK
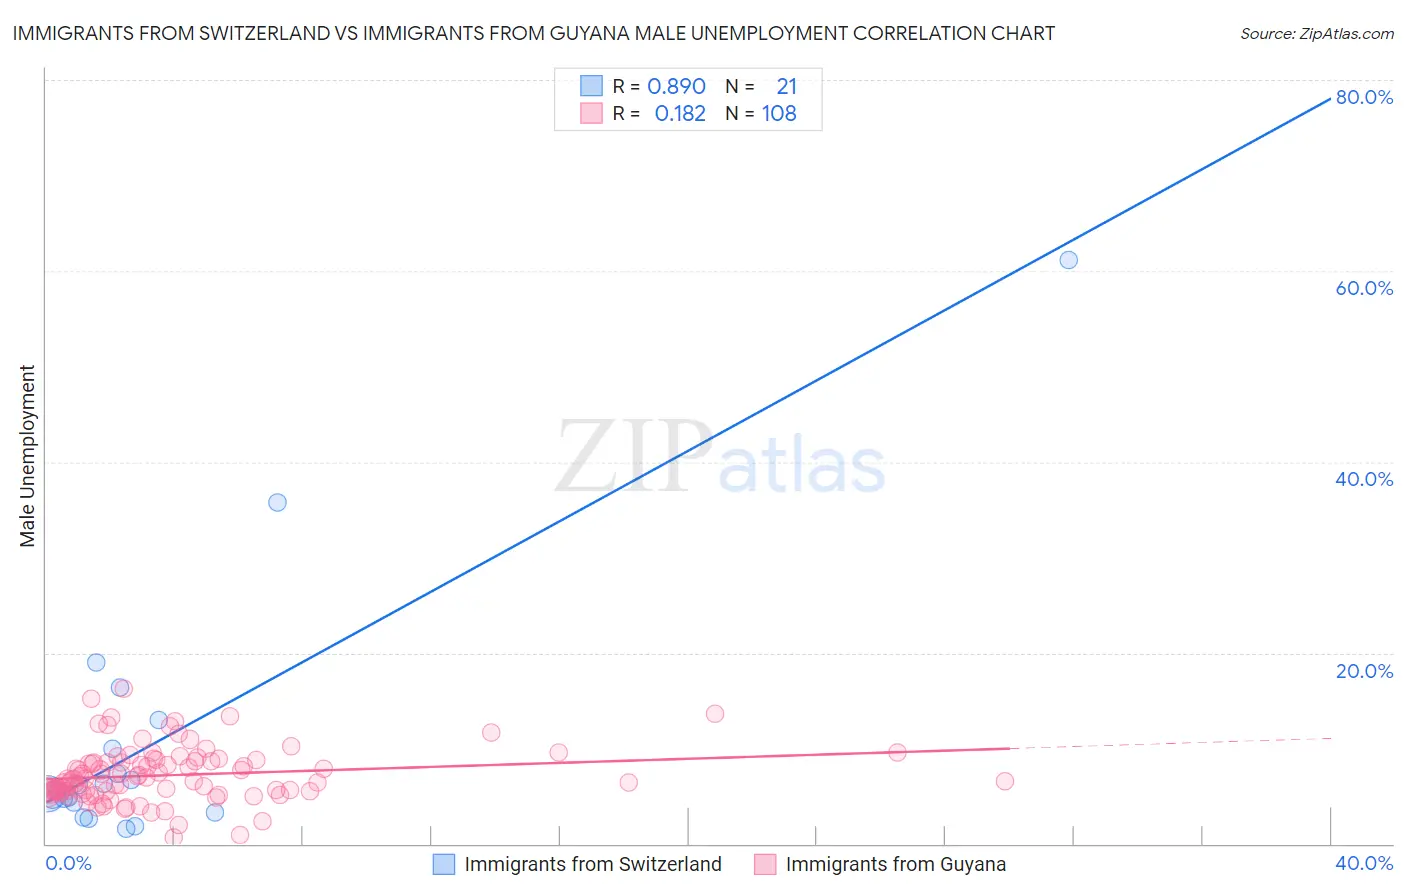
Immigrants from Switzerland vs Immigrants from Guyana Male Unemployment Correlation Chart
The statistical analysis conducted on geographies consisting of 147,847,273 people shows a very strong positive correlation between the proportion of Immigrants from Switzerland and unemployment rate among males in the United States with a correlation coefficient (R) of 0.890 and weighted average of 5.2%. Similarly, the statistical analysis conducted on geographies consisting of 183,427,886 people shows a poor positive correlation between the proportion of Immigrants from Guyana and unemployment rate among males in the United States with a correlation coefficient (R) of 0.182 and weighted average of 7.1%, a difference of 37.0%.
Male Unemployment Correlation Summary
| Measurement | Immigrants from Switzerland | Immigrants from Guyana |
| Minimum | 1.6% | 0.60% |
| Maximum | 61.1% | 16.2% |
| Range | 59.5% | 15.6% |
| Mean | 10.6% | 7.2% |
| Median | 5.6% | 6.7% |
| Interquartile 25% (IQ1) | 3.8% | 5.4% |
| Interquartile 75% (IQ3) | 11.5% | 8.7% |
| Interquartile Range (IQR) | 7.7% | 3.3% |
| Standard Deviation (Sample) | 13.9% | 2.8% |
| Standard Deviation (Population) | 13.6% | 2.8% |
Similar Demographics by Male Unemployment
Demographics Similar to Immigrants from Switzerland by Male Unemployment
In terms of male unemployment, the demographic groups most similar to Immigrants from Switzerland are Brazilian (5.2%, a difference of 0.010%), Kenyan (5.2%, a difference of 0.020%), Immigrants from Croatia (5.2%, a difference of 0.040%), Immigrants from Eastern Africa (5.2%, a difference of 0.050%), and Lebanese (5.2%, a difference of 0.060%).
| Demographics | Rating | Rank | Male Unemployment |
| Pakistanis | 80.5 /100 | #134 | Excellent 5.2% |
| Immigrants | Saudi Arabia | 80.1 /100 | #135 | Excellent 5.2% |
| Lebanese | 79.9 /100 | #136 | Good 5.2% |
| Immigrants | Eastern Africa | 79.8 /100 | #137 | Good 5.2% |
| Immigrants | Croatia | 79.7 /100 | #138 | Good 5.2% |
| Kenyans | 79.4 /100 | #139 | Good 5.2% |
| Brazilians | 79.3 /100 | #140 | Good 5.2% |
| Immigrants | Switzerland | 79.2 /100 | #141 | Good 5.2% |
| Fijians | 78.3 /100 | #142 | Good 5.2% |
| Syrians | 78.0 /100 | #143 | Good 5.2% |
| Sri Lankans | 77.9 /100 | #144 | Good 5.2% |
| Macedonians | 77.7 /100 | #145 | Good 5.2% |
| Immigrants | Kenya | 77.6 /100 | #146 | Good 5.2% |
| Immigrants | Burma/Myanmar | 77.5 /100 | #147 | Good 5.2% |
| Immigrants | Italy | 76.3 /100 | #148 | Good 5.2% |
Demographics Similar to Immigrants from Guyana by Male Unemployment
In terms of male unemployment, the demographic groups most similar to Immigrants from Guyana are Houma (7.1%, a difference of 0.030%), Guyanese (7.1%, a difference of 0.060%), Cape Verdean (7.1%, a difference of 0.12%), Immigrants from Barbados (7.1%, a difference of 0.24%), and Immigrants from Dominica (7.0%, a difference of 1.5%).
| Demographics | Rating | Rank | Male Unemployment |
| Barbadians | 0.0 /100 | #309 | Tragic 6.9% |
| Blacks/African Americans | 0.0 /100 | #310 | Tragic 6.9% |
| Immigrants | Armenia | 0.0 /100 | #311 | Tragic 6.9% |
| Lumbee | 0.0 /100 | #312 | Tragic 6.9% |
| Immigrants | Dominica | 0.0 /100 | #313 | Tragic 7.0% |
| Immigrants | Barbados | 0.0 /100 | #314 | Tragic 7.1% |
| Houma | 0.0 /100 | #315 | Tragic 7.1% |
| Immigrants | Guyana | 0.0 /100 | #316 | Tragic 7.1% |
| Guyanese | 0.0 /100 | #317 | Tragic 7.1% |
| Cape Verdeans | 0.0 /100 | #318 | Tragic 7.1% |
| British West Indians | 0.0 /100 | #319 | Tragic 7.3% |
| Colville | 0.0 /100 | #320 | Tragic 7.4% |
| Immigrants | St. Vincent and the Grenadines | 0.0 /100 | #321 | Tragic 7.5% |
| Immigrants | Cabo Verde | 0.0 /100 | #322 | Tragic 7.5% |
| Immigrants | Grenada | 0.0 /100 | #323 | Tragic 7.6% |