Tongan vs Inupiat Male Unemployment
COMPARE
Tongan
Inupiat
Male Unemployment
Male Unemployment Comparison
Tongans
Inupiat
4.8%
MALE UNEMPLOYMENT
99.9/ 100
METRIC RATING
23rd/ 347
METRIC RANK
12.1%
MALE UNEMPLOYMENT
0.0/ 100
METRIC RATING
346th/ 347
METRIC RANK
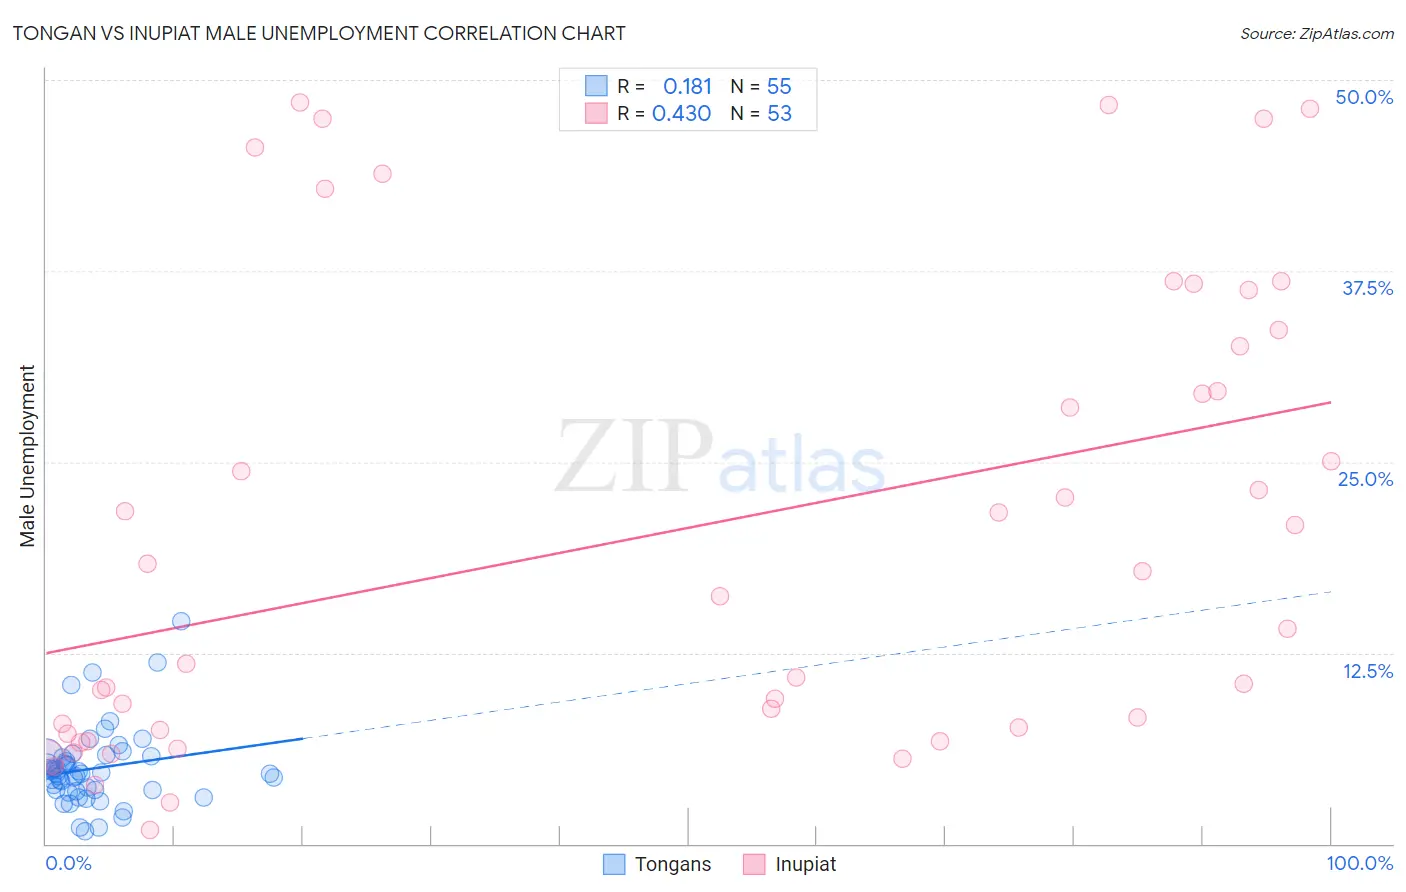
Tongan vs Inupiat Male Unemployment Correlation Chart
The statistical analysis conducted on geographies consisting of 102,801,849 people shows a poor positive correlation between the proportion of Tongans and unemployment rate among males in the United States with a correlation coefficient (R) of 0.181 and weighted average of 4.8%. Similarly, the statistical analysis conducted on geographies consisting of 96,169,254 people shows a moderate positive correlation between the proportion of Inupiat and unemployment rate among males in the United States with a correlation coefficient (R) of 0.430 and weighted average of 12.1%, a difference of 153.1%.
Male Unemployment Correlation Summary
| Measurement | Tongan | Inupiat |
| Minimum | 0.80% | 0.90% |
| Maximum | 14.6% | 48.5% |
| Range | 13.8% | 47.6% |
| Mean | 4.9% | 20.4% |
| Median | 4.6% | 16.2% |
| Interquartile 25% (IQ1) | 3.5% | 7.3% |
| Interquartile 75% (IQ3) | 5.7% | 33.1% |
| Interquartile Range (IQR) | 2.2% | 25.8% |
| Standard Deviation (Sample) | 2.5% | 15.0% |
| Standard Deviation (Population) | 2.5% | 14.9% |
Similar Demographics by Male Unemployment
Demographics Similar to Tongans by Male Unemployment
In terms of male unemployment, the demographic groups most similar to Tongans are Immigrants from South Central Asia (4.8%, a difference of 0.030%), Carpatho Rusyn (4.8%, a difference of 0.040%), Immigrants from Taiwan (4.8%, a difference of 0.060%), Zimbabwean (4.8%, a difference of 0.13%), and Dutch (4.8%, a difference of 0.15%).
| Demographics | Rating | Rank | Male Unemployment |
| Swiss | 99.9 /100 | #16 | Exceptional 4.7% |
| Filipinos | 99.9 /100 | #17 | Exceptional 4.7% |
| English | 99.9 /100 | #18 | Exceptional 4.8% |
| Europeans | 99.9 /100 | #19 | Exceptional 4.8% |
| Pennsylvania Germans | 99.9 /100 | #20 | Exceptional 4.8% |
| Immigrants | Taiwan | 99.9 /100 | #21 | Exceptional 4.8% |
| Carpatho Rusyns | 99.9 /100 | #22 | Exceptional 4.8% |
| Tongans | 99.9 /100 | #23 | Exceptional 4.8% |
| Immigrants | South Central Asia | 99.9 /100 | #24 | Exceptional 4.8% |
| Zimbabweans | 99.9 /100 | #25 | Exceptional 4.8% |
| Dutch | 99.9 /100 | #26 | Exceptional 4.8% |
| Belgians | 99.9 /100 | #27 | Exceptional 4.8% |
| Bulgarians | 99.8 /100 | #28 | Exceptional 4.8% |
| Scottish | 99.8 /100 | #29 | Exceptional 4.8% |
| British | 99.8 /100 | #30 | Exceptional 4.8% |
Demographics Similar to Inupiat by Male Unemployment
In terms of male unemployment, the demographic groups most similar to Inupiat are Arapaho (11.0%, a difference of 9.8%), Hopi (10.8%, a difference of 12.0%), Crow (10.6%, a difference of 13.8%), Tohono O'odham (10.2%, a difference of 18.8%), and Navajo (9.8%, a difference of 22.9%).
| Demographics | Rating | Rank | Male Unemployment |
| Sioux | 0.0 /100 | #333 | Tragic 8.4% |
| Tsimshian | 0.0 /100 | #334 | Tragic 8.5% |
| Pueblo | 0.0 /100 | #335 | Tragic 8.5% |
| Yuman | 0.0 /100 | #336 | Tragic 8.6% |
| Puerto Ricans | 0.0 /100 | #337 | Tragic 8.6% |
| Apache | 0.0 /100 | #338 | Tragic 8.6% |
| Cheyenne | 0.0 /100 | #339 | Tragic 9.8% |
| Alaskan Athabascans | 0.0 /100 | #340 | Tragic 9.8% |
| Navajo | 0.0 /100 | #341 | Tragic 9.8% |
| Tohono O'odham | 0.0 /100 | #342 | Tragic 10.2% |
| Crow | 0.0 /100 | #343 | Tragic 10.6% |
| Hopi | 0.0 /100 | #344 | Tragic 10.8% |
| Arapaho | 0.0 /100 | #345 | Tragic 11.0% |
| Inupiat | 0.0 /100 | #346 | Tragic 12.1% |
| Yup'ik | 0.0 /100 | #347 | Tragic 16.4% |