Immigrants from Sudan vs Inupiat Male Unemployment
COMPARE
Immigrants from Sudan
Inupiat
Male Unemployment
Male Unemployment Comparison
Immigrants from Sudan
Inupiat
5.0%
MALE UNEMPLOYMENT
96.5/ 100
METRIC RATING
76th/ 347
METRIC RANK
12.1%
MALE UNEMPLOYMENT
0.0/ 100
METRIC RATING
346th/ 347
METRIC RANK
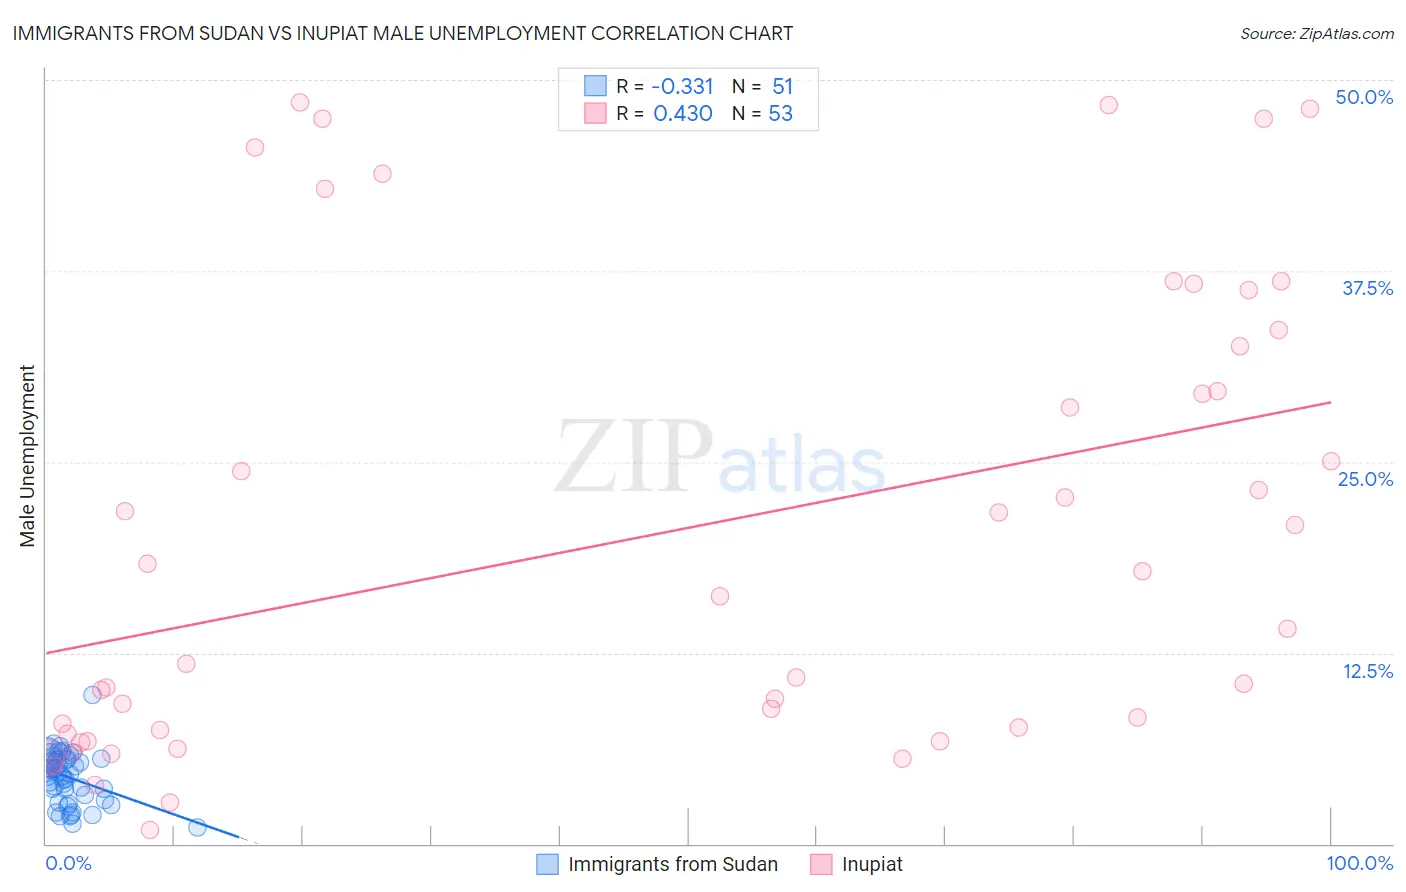
Immigrants from Sudan vs Inupiat Male Unemployment Correlation Chart
The statistical analysis conducted on geographies consisting of 118,895,845 people shows a mild negative correlation between the proportion of Immigrants from Sudan and unemployment rate among males in the United States with a correlation coefficient (R) of -0.331 and weighted average of 5.0%. Similarly, the statistical analysis conducted on geographies consisting of 96,169,254 people shows a moderate positive correlation between the proportion of Inupiat and unemployment rate among males in the United States with a correlation coefficient (R) of 0.430 and weighted average of 12.1%, a difference of 139.7%.
Male Unemployment Correlation Summary
| Measurement | Immigrants from Sudan | Inupiat |
| Minimum | 1.1% | 0.90% |
| Maximum | 9.7% | 48.5% |
| Range | 8.6% | 47.6% |
| Mean | 4.3% | 20.4% |
| Median | 4.6% | 16.2% |
| Interquartile 25% (IQ1) | 2.9% | 7.3% |
| Interquartile 75% (IQ3) | 5.6% | 33.1% |
| Interquartile Range (IQR) | 2.7% | 25.8% |
| Standard Deviation (Sample) | 1.7% | 15.0% |
| Standard Deviation (Population) | 1.7% | 14.9% |
Similar Demographics by Male Unemployment
Demographics Similar to Immigrants from Sudan by Male Unemployment
In terms of male unemployment, the demographic groups most similar to Immigrants from Sudan are Iranian (5.0%, a difference of 0.050%), Immigrants from Northern Europe (5.0%, a difference of 0.060%), South African (5.0%, a difference of 0.070%), Argentinean (5.0%, a difference of 0.12%), and French (5.0%, a difference of 0.13%).
| Demographics | Rating | Rank | Male Unemployment |
| Immigrants | Sweden | 97.4 /100 | #69 | Exceptional 5.0% |
| Whites/Caucasians | 97.3 /100 | #70 | Exceptional 5.0% |
| New Zealanders | 97.3 /100 | #71 | Exceptional 5.0% |
| Immigrants | South Africa | 97.1 /100 | #72 | Exceptional 5.0% |
| Greeks | 97.0 /100 | #73 | Exceptional 5.0% |
| Immigrants | North America | 96.9 /100 | #74 | Exceptional 5.0% |
| Assyrians/Chaldeans/Syriacs | 96.9 /100 | #75 | Exceptional 5.0% |
| Immigrants | Sudan | 96.5 /100 | #76 | Exceptional 5.0% |
| Iranians | 96.4 /100 | #77 | Exceptional 5.0% |
| Immigrants | Northern Europe | 96.4 /100 | #78 | Exceptional 5.0% |
| South Africans | 96.4 /100 | #79 | Exceptional 5.0% |
| Argentineans | 96.2 /100 | #80 | Exceptional 5.0% |
| French | 96.2 /100 | #81 | Exceptional 5.0% |
| Chileans | 96.2 /100 | #82 | Exceptional 5.0% |
| Immigrants | Eritrea | 96.0 /100 | #83 | Exceptional 5.0% |
Demographics Similar to Inupiat by Male Unemployment
In terms of male unemployment, the demographic groups most similar to Inupiat are Arapaho (11.0%, a difference of 9.8%), Hopi (10.8%, a difference of 12.0%), Crow (10.6%, a difference of 13.8%), Tohono O'odham (10.2%, a difference of 18.8%), and Navajo (9.8%, a difference of 22.9%).
| Demographics | Rating | Rank | Male Unemployment |
| Sioux | 0.0 /100 | #333 | Tragic 8.4% |
| Tsimshian | 0.0 /100 | #334 | Tragic 8.5% |
| Pueblo | 0.0 /100 | #335 | Tragic 8.5% |
| Yuman | 0.0 /100 | #336 | Tragic 8.6% |
| Puerto Ricans | 0.0 /100 | #337 | Tragic 8.6% |
| Apache | 0.0 /100 | #338 | Tragic 8.6% |
| Cheyenne | 0.0 /100 | #339 | Tragic 9.8% |
| Alaskan Athabascans | 0.0 /100 | #340 | Tragic 9.8% |
| Navajo | 0.0 /100 | #341 | Tragic 9.8% |
| Tohono O'odham | 0.0 /100 | #342 | Tragic 10.2% |
| Crow | 0.0 /100 | #343 | Tragic 10.6% |
| Hopi | 0.0 /100 | #344 | Tragic 10.8% |
| Arapaho | 0.0 /100 | #345 | Tragic 11.0% |
| Inupiat | 0.0 /100 | #346 | Tragic 12.1% |
| Yup'ik | 0.0 /100 | #347 | Tragic 16.4% |