Immigrants from Switzerland vs Immigrants from Denmark Male Unemployment
COMPARE
Immigrants from Switzerland
Immigrants from Denmark
Male Unemployment
Male Unemployment Comparison
Immigrants from Switzerland
Immigrants from Denmark
5.2%
MALE UNEMPLOYMENT
79.2/ 100
METRIC RATING
141st/ 347
METRIC RANK
5.1%
MALE UNEMPLOYMENT
89.4/ 100
METRIC RATING
116th/ 347
METRIC RANK
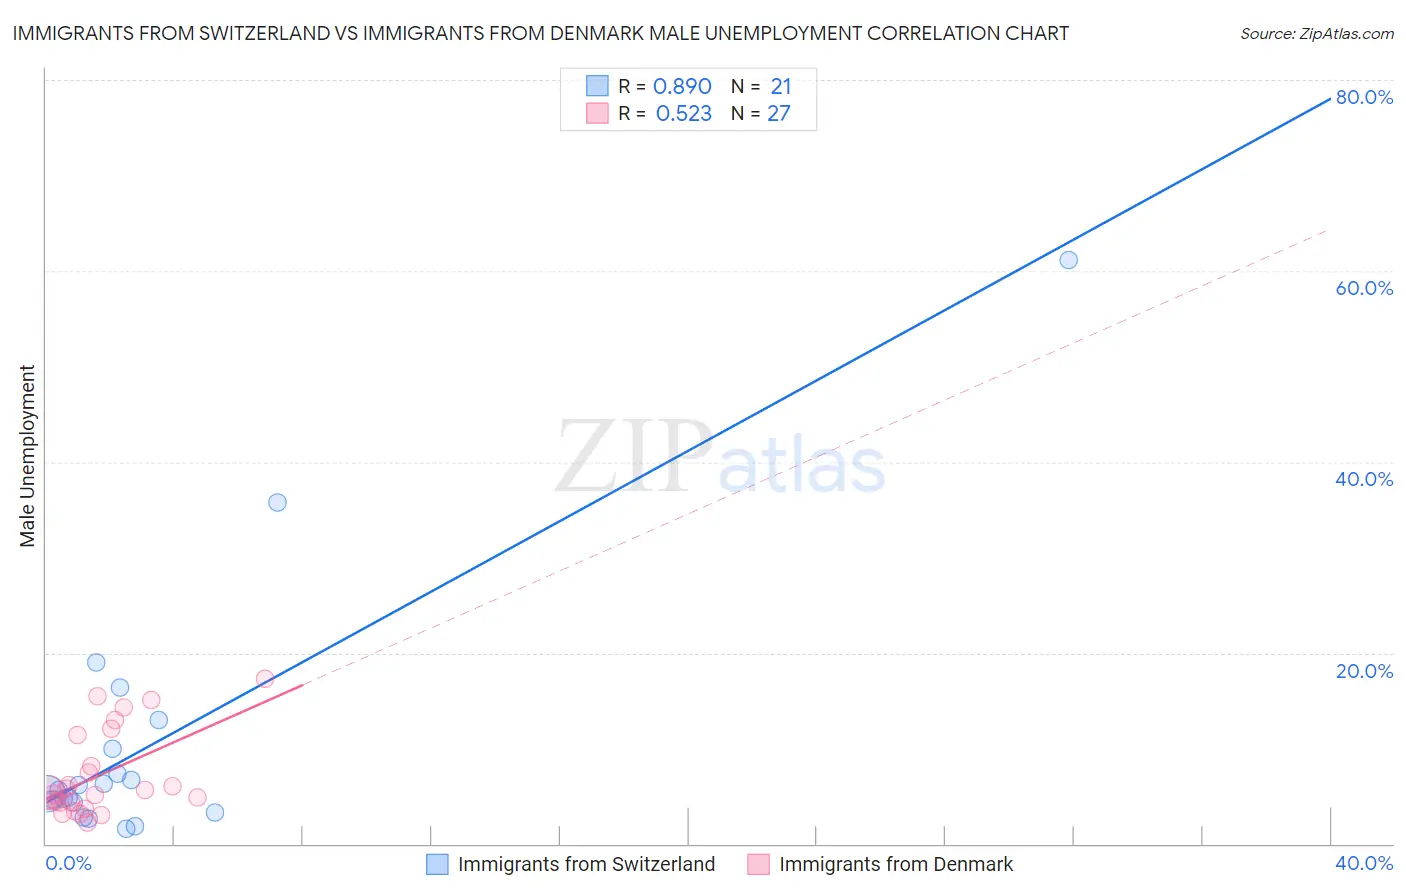
Immigrants from Switzerland vs Immigrants from Denmark Male Unemployment Correlation Chart
The statistical analysis conducted on geographies consisting of 147,847,273 people shows a very strong positive correlation between the proportion of Immigrants from Switzerland and unemployment rate among males in the United States with a correlation coefficient (R) of 0.890 and weighted average of 5.2%. Similarly, the statistical analysis conducted on geographies consisting of 136,170,297 people shows a substantial positive correlation between the proportion of Immigrants from Denmark and unemployment rate among males in the United States with a correlation coefficient (R) of 0.523 and weighted average of 5.1%, a difference of 1.2%.
Male Unemployment Correlation Summary
| Measurement | Immigrants from Switzerland | Immigrants from Denmark |
| Minimum | 1.6% | 2.2% |
| Maximum | 61.1% | 17.3% |
| Range | 59.5% | 15.1% |
| Mean | 10.6% | 7.2% |
| Median | 5.6% | 5.4% |
| Interquartile 25% (IQ1) | 3.8% | 4.3% |
| Interquartile 75% (IQ3) | 11.5% | 11.4% |
| Interquartile Range (IQR) | 7.7% | 7.1% |
| Standard Deviation (Sample) | 13.9% | 4.4% |
| Standard Deviation (Population) | 13.6% | 4.4% |
Similar Demographics by Male Unemployment
Demographics Similar to Immigrants from Switzerland by Male Unemployment
In terms of male unemployment, the demographic groups most similar to Immigrants from Switzerland are Brazilian (5.2%, a difference of 0.010%), Kenyan (5.2%, a difference of 0.020%), Immigrants from Croatia (5.2%, a difference of 0.040%), Immigrants from Eastern Africa (5.2%, a difference of 0.050%), and Lebanese (5.2%, a difference of 0.060%).
| Demographics | Rating | Rank | Male Unemployment |
| Pakistanis | 80.5 /100 | #134 | Excellent 5.2% |
| Immigrants | Saudi Arabia | 80.1 /100 | #135 | Excellent 5.2% |
| Lebanese | 79.9 /100 | #136 | Good 5.2% |
| Immigrants | Eastern Africa | 79.8 /100 | #137 | Good 5.2% |
| Immigrants | Croatia | 79.7 /100 | #138 | Good 5.2% |
| Kenyans | 79.4 /100 | #139 | Good 5.2% |
| Brazilians | 79.3 /100 | #140 | Good 5.2% |
| Immigrants | Switzerland | 79.2 /100 | #141 | Good 5.2% |
| Fijians | 78.3 /100 | #142 | Good 5.2% |
| Syrians | 78.0 /100 | #143 | Good 5.2% |
| Sri Lankans | 77.9 /100 | #144 | Good 5.2% |
| Macedonians | 77.7 /100 | #145 | Good 5.2% |
| Immigrants | Kenya | 77.6 /100 | #146 | Good 5.2% |
| Immigrants | Burma/Myanmar | 77.5 /100 | #147 | Good 5.2% |
| Immigrants | Italy | 76.3 /100 | #148 | Good 5.2% |
Demographics Similar to Immigrants from Denmark by Male Unemployment
In terms of male unemployment, the demographic groups most similar to Immigrants from Denmark are Immigrants from Asia (5.1%, a difference of 0.040%), Estonian (5.1%, a difference of 0.050%), Romanian (5.1%, a difference of 0.070%), Cypriot (5.1%, a difference of 0.080%), and French Canadian (5.1%, a difference of 0.12%).
| Demographics | Rating | Rank | Male Unemployment |
| Immigrants | Pakistan | 90.9 /100 | #109 | Exceptional 5.1% |
| Immigrants | England | 90.8 /100 | #110 | Exceptional 5.1% |
| Immigrants | Eastern Asia | 90.8 /100 | #111 | Exceptional 5.1% |
| Immigrants | Moldova | 90.3 /100 | #112 | Exceptional 5.1% |
| Immigrants | Austria | 90.3 /100 | #113 | Exceptional 5.1% |
| Romanians | 89.8 /100 | #114 | Excellent 5.1% |
| Immigrants | Asia | 89.6 /100 | #115 | Excellent 5.1% |
| Immigrants | Denmark | 89.4 /100 | #116 | Excellent 5.1% |
| Estonians | 89.0 /100 | #117 | Excellent 5.1% |
| Cypriots | 88.8 /100 | #118 | Excellent 5.1% |
| French Canadians | 88.6 /100 | #119 | Excellent 5.1% |
| Ukrainians | 88.4 /100 | #120 | Excellent 5.1% |
| Mongolians | 88.4 /100 | #121 | Excellent 5.1% |
| Nicaraguans | 88.2 /100 | #122 | Excellent 5.1% |
| Palestinians | 87.7 /100 | #123 | Excellent 5.1% |