Immigrants from Sudan vs Cajun Male Unemployment
COMPARE
Immigrants from Sudan
Cajun
Male Unemployment
Male Unemployment Comparison
Immigrants from Sudan
Cajuns
5.0%
MALE UNEMPLOYMENT
96.5/ 100
METRIC RATING
76th/ 347
METRIC RANK
5.8%
MALE UNEMPLOYMENT
0.1/ 100
METRIC RATING
259th/ 347
METRIC RANK
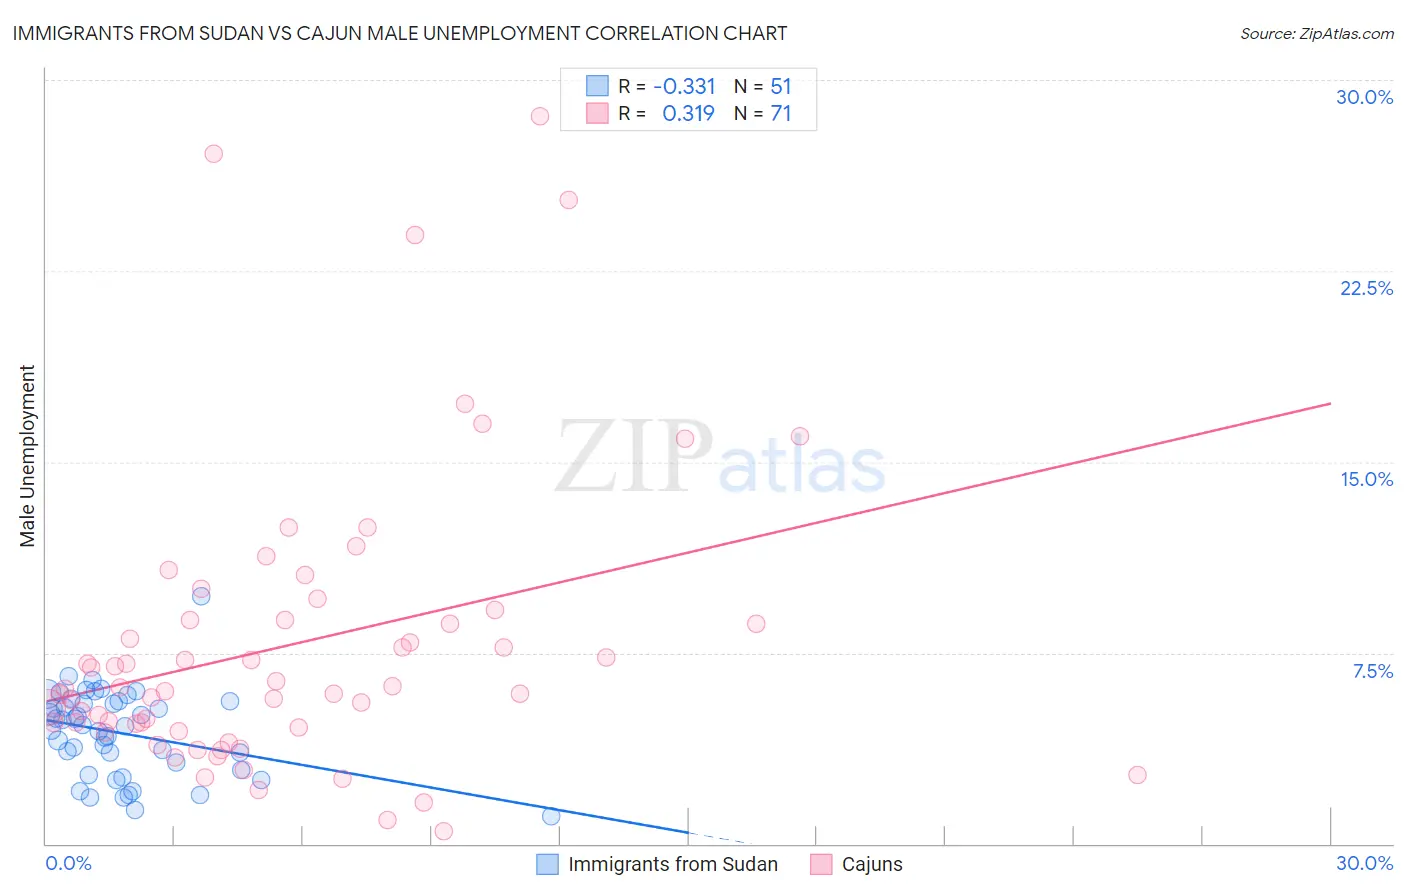
Immigrants from Sudan vs Cajun Male Unemployment Correlation Chart
The statistical analysis conducted on geographies consisting of 118,895,845 people shows a mild negative correlation between the proportion of Immigrants from Sudan and unemployment rate among males in the United States with a correlation coefficient (R) of -0.331 and weighted average of 5.0%. Similarly, the statistical analysis conducted on geographies consisting of 149,208,256 people shows a mild positive correlation between the proportion of Cajuns and unemployment rate among males in the United States with a correlation coefficient (R) of 0.319 and weighted average of 5.8%, a difference of 15.5%.
Male Unemployment Correlation Summary
| Measurement | Immigrants from Sudan | Cajun |
| Minimum | 1.1% | 0.50% |
| Maximum | 9.7% | 28.6% |
| Range | 8.6% | 28.1% |
| Mean | 4.3% | 7.8% |
| Median | 4.6% | 6.1% |
| Interquartile 25% (IQ1) | 2.9% | 4.6% |
| Interquartile 75% (IQ3) | 5.6% | 8.8% |
| Interquartile Range (IQR) | 2.7% | 4.2% |
| Standard Deviation (Sample) | 1.7% | 5.8% |
| Standard Deviation (Population) | 1.7% | 5.7% |
Similar Demographics by Male Unemployment
Demographics Similar to Immigrants from Sudan by Male Unemployment
In terms of male unemployment, the demographic groups most similar to Immigrants from Sudan are Iranian (5.0%, a difference of 0.050%), Immigrants from Northern Europe (5.0%, a difference of 0.060%), South African (5.0%, a difference of 0.070%), Argentinean (5.0%, a difference of 0.12%), and French (5.0%, a difference of 0.13%).
| Demographics | Rating | Rank | Male Unemployment |
| Immigrants | Sweden | 97.4 /100 | #69 | Exceptional 5.0% |
| Whites/Caucasians | 97.3 /100 | #70 | Exceptional 5.0% |
| New Zealanders | 97.3 /100 | #71 | Exceptional 5.0% |
| Immigrants | South Africa | 97.1 /100 | #72 | Exceptional 5.0% |
| Greeks | 97.0 /100 | #73 | Exceptional 5.0% |
| Immigrants | North America | 96.9 /100 | #74 | Exceptional 5.0% |
| Assyrians/Chaldeans/Syriacs | 96.9 /100 | #75 | Exceptional 5.0% |
| Immigrants | Sudan | 96.5 /100 | #76 | Exceptional 5.0% |
| Iranians | 96.4 /100 | #77 | Exceptional 5.0% |
| Immigrants | Northern Europe | 96.4 /100 | #78 | Exceptional 5.0% |
| South Africans | 96.4 /100 | #79 | Exceptional 5.0% |
| Argentineans | 96.2 /100 | #80 | Exceptional 5.0% |
| French | 96.2 /100 | #81 | Exceptional 5.0% |
| Chileans | 96.2 /100 | #82 | Exceptional 5.0% |
| Immigrants | Eritrea | 96.0 /100 | #83 | Exceptional 5.0% |
Demographics Similar to Cajuns by Male Unemployment
In terms of male unemployment, the demographic groups most similar to Cajuns are Immigrants from Central America (5.8%, a difference of 0.060%), Dutch West Indian (5.8%, a difference of 0.15%), Liberian (5.8%, a difference of 0.24%), Hispanic or Latino (5.8%, a difference of 0.29%), and Comanche (5.8%, a difference of 0.46%).
| Demographics | Rating | Rank | Male Unemployment |
| Mexicans | 0.2 /100 | #252 | Tragic 5.8% |
| Mexican American Indians | 0.2 /100 | #253 | Tragic 5.8% |
| Japanese | 0.2 /100 | #254 | Tragic 5.8% |
| Kiowa | 0.2 /100 | #255 | Tragic 5.8% |
| Comanche | 0.2 /100 | #256 | Tragic 5.8% |
| Hispanics or Latinos | 0.1 /100 | #257 | Tragic 5.8% |
| Dutch West Indians | 0.1 /100 | #258 | Tragic 5.8% |
| Cajuns | 0.1 /100 | #259 | Tragic 5.8% |
| Immigrants | Central America | 0.1 /100 | #260 | Tragic 5.8% |
| Liberians | 0.1 /100 | #261 | Tragic 5.8% |
| Immigrants | Portugal | 0.1 /100 | #262 | Tragic 5.9% |
| Immigrants | Latin America | 0.1 /100 | #263 | Tragic 5.9% |
| Immigrants | Mexico | 0.0 /100 | #264 | Tragic 5.9% |
| French American Indians | 0.0 /100 | #265 | Tragic 5.9% |
| Bahamians | 0.0 /100 | #266 | Tragic 5.9% |