Immigrants from Sudan vs Inupiat Median Female Earnings
COMPARE
Immigrants from Sudan
Inupiat
Median Female Earnings
Median Female Earnings Comparison
Immigrants from Sudan
Inupiat
$38,511
MEDIAN FEMALE EARNINGS
7.8/ 100
METRIC RATING
223rd/ 347
METRIC RANK
$40,080
MEDIAN FEMALE EARNINGS
68.9/ 100
METRIC RATING
160th/ 347
METRIC RANK
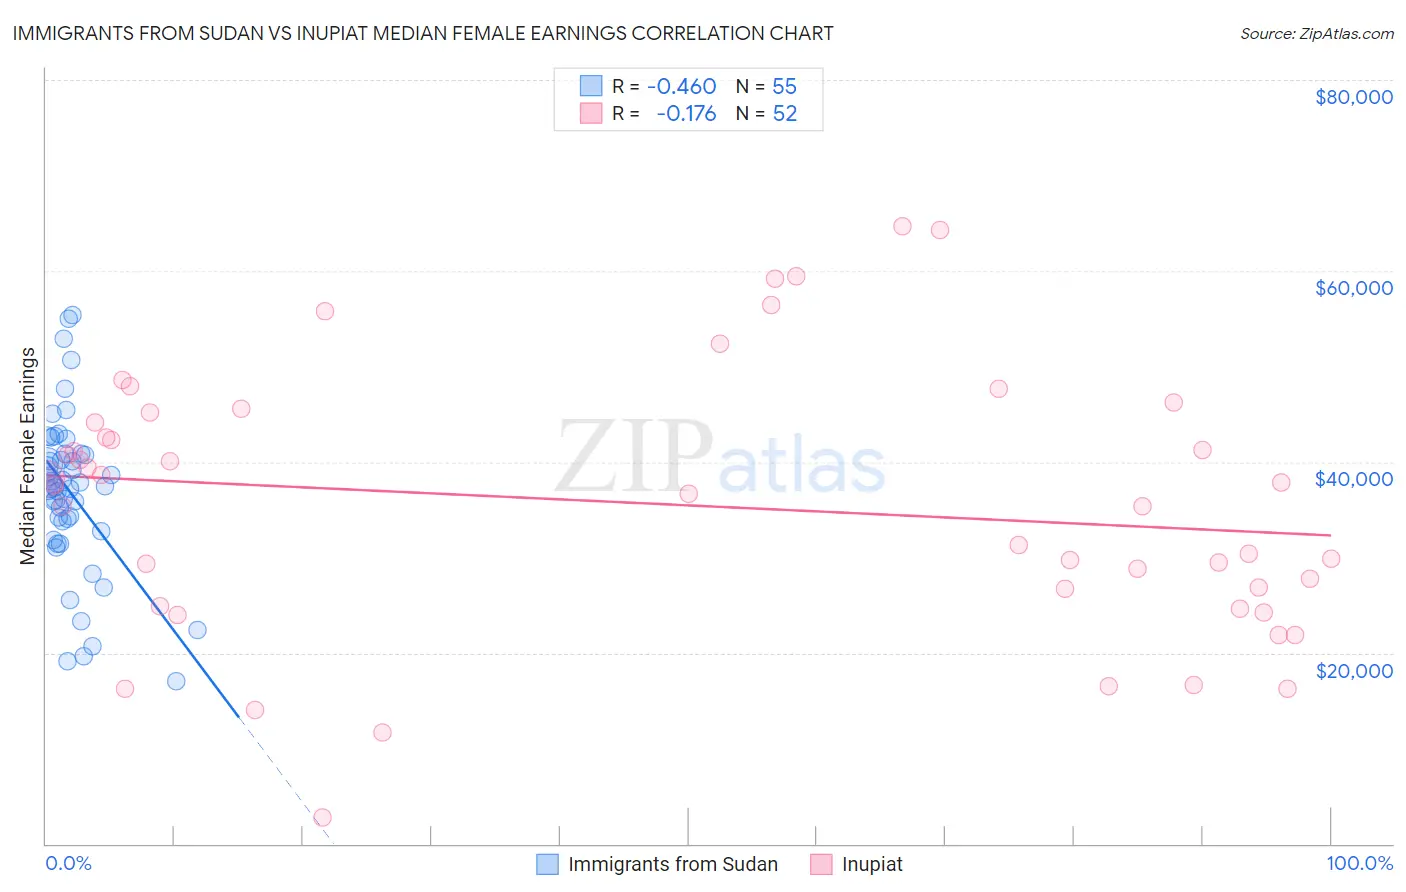
Immigrants from Sudan vs Inupiat Median Female Earnings Correlation Chart
The statistical analysis conducted on geographies consisting of 118,958,094 people shows a moderate negative correlation between the proportion of Immigrants from Sudan and median female earnings in the United States with a correlation coefficient (R) of -0.460 and weighted average of $38,511. Similarly, the statistical analysis conducted on geographies consisting of 96,311,190 people shows a poor negative correlation between the proportion of Inupiat and median female earnings in the United States with a correlation coefficient (R) of -0.176 and weighted average of $40,080, a difference of 4.1%.
Median Female Earnings Correlation Summary
| Measurement | Immigrants from Sudan | Inupiat |
| Minimum | $17,051 | $2,800 |
| Maximum | $55,449 | $64,688 |
| Range | $38,398 | $61,888 |
| Mean | $36,677 | $35,589 |
| Median | $37,284 | $37,155 |
| Interquartile 25% (IQ1) | $32,734 | $25,800 |
| Interquartile 75% (IQ3) | $40,805 | $44,695 |
| Interquartile Range (IQR) | $8,071 | $18,895 |
| Standard Deviation (Sample) | $8,385 | $13,962 |
| Standard Deviation (Population) | $8,308 | $13,827 |
Similar Demographics by Median Female Earnings
Demographics Similar to Immigrants from Sudan by Median Female Earnings
In terms of median female earnings, the demographic groups most similar to Immigrants from Sudan are Japanese ($38,528, a difference of 0.040%), Native Hawaiian ($38,461, a difference of 0.13%), French ($38,457, a difference of 0.14%), Yugoslavian ($38,573, a difference of 0.16%), and Immigrants from the Azores ($38,573, a difference of 0.16%).
| Demographics | Rating | Rank | Median Female Earnings |
| Immigrants | Ecuador | 10.1 /100 | #216 | Poor $38,644 |
| Immigrants | Jamaica | 9.7 /100 | #217 | Tragic $38,625 |
| Cape Verdeans | 9.5 /100 | #218 | Tragic $38,614 |
| Nepalese | 9.3 /100 | #219 | Tragic $38,603 |
| Yugoslavians | 8.8 /100 | #220 | Tragic $38,573 |
| Immigrants | Azores | 8.8 /100 | #221 | Tragic $38,573 |
| Japanese | 8.1 /100 | #222 | Tragic $38,528 |
| Immigrants | Sudan | 7.8 /100 | #223 | Tragic $38,511 |
| Native Hawaiians | 7.1 /100 | #224 | Tragic $38,461 |
| French | 7.0 /100 | #225 | Tragic $38,457 |
| French Canadians | 6.8 /100 | #226 | Tragic $38,436 |
| Scottish | 6.3 /100 | #227 | Tragic $38,397 |
| Sub-Saharan Africans | 6.2 /100 | #228 | Tragic $38,391 |
| Belgians | 6.1 /100 | #229 | Tragic $38,382 |
| Basques | 5.7 /100 | #230 | Tragic $38,352 |
Demographics Similar to Inupiat by Median Female Earnings
In terms of median female earnings, the demographic groups most similar to Inupiat are Alsatian ($40,060, a difference of 0.050%), South American Indian ($40,019, a difference of 0.15%), Immigrants from Vietnam ($40,153, a difference of 0.18%), Lebanese ($40,006, a difference of 0.18%), and Immigrants from Senegal ($40,157, a difference of 0.19%).
| Demographics | Rating | Rank | Median Female Earnings |
| British West Indians | 77.7 /100 | #153 | Good $40,299 |
| Immigrants | Oceania | 77.6 /100 | #154 | Good $40,297 |
| Immigrants | Africa | 76.2 /100 | #155 | Good $40,257 |
| Peruvians | 75.3 /100 | #156 | Good $40,234 |
| Portuguese | 73.0 /100 | #157 | Good $40,177 |
| Immigrants | Senegal | 72.2 /100 | #158 | Good $40,157 |
| Immigrants | Vietnam | 72.0 /100 | #159 | Good $40,153 |
| Inupiat | 68.9 /100 | #160 | Good $40,080 |
| Alsatians | 68.0 /100 | #161 | Good $40,060 |
| South American Indians | 66.1 /100 | #162 | Good $40,019 |
| Lebanese | 65.5 /100 | #163 | Good $40,006 |
| Immigrants | Saudi Arabia | 62.9 /100 | #164 | Good $39,952 |
| Immigrants | Bangladesh | 60.8 /100 | #165 | Good $39,910 |
| Immigrants | Ghana | 60.0 /100 | #166 | Good $39,894 |
| Luxembourgers | 59.9 /100 | #167 | Average $39,891 |