Immigrants from Sudan vs Inupiat 8th Grade
COMPARE
Immigrants from Sudan
Inupiat
8th Grade
8th Grade Comparison
Immigrants from Sudan
Inupiat
95.5%
8TH GRADE
15.1/ 100
METRIC RATING
207th/ 347
METRIC RANK
97.0%
8TH GRADE
100.0/ 100
METRIC RATING
40th/ 347
METRIC RANK
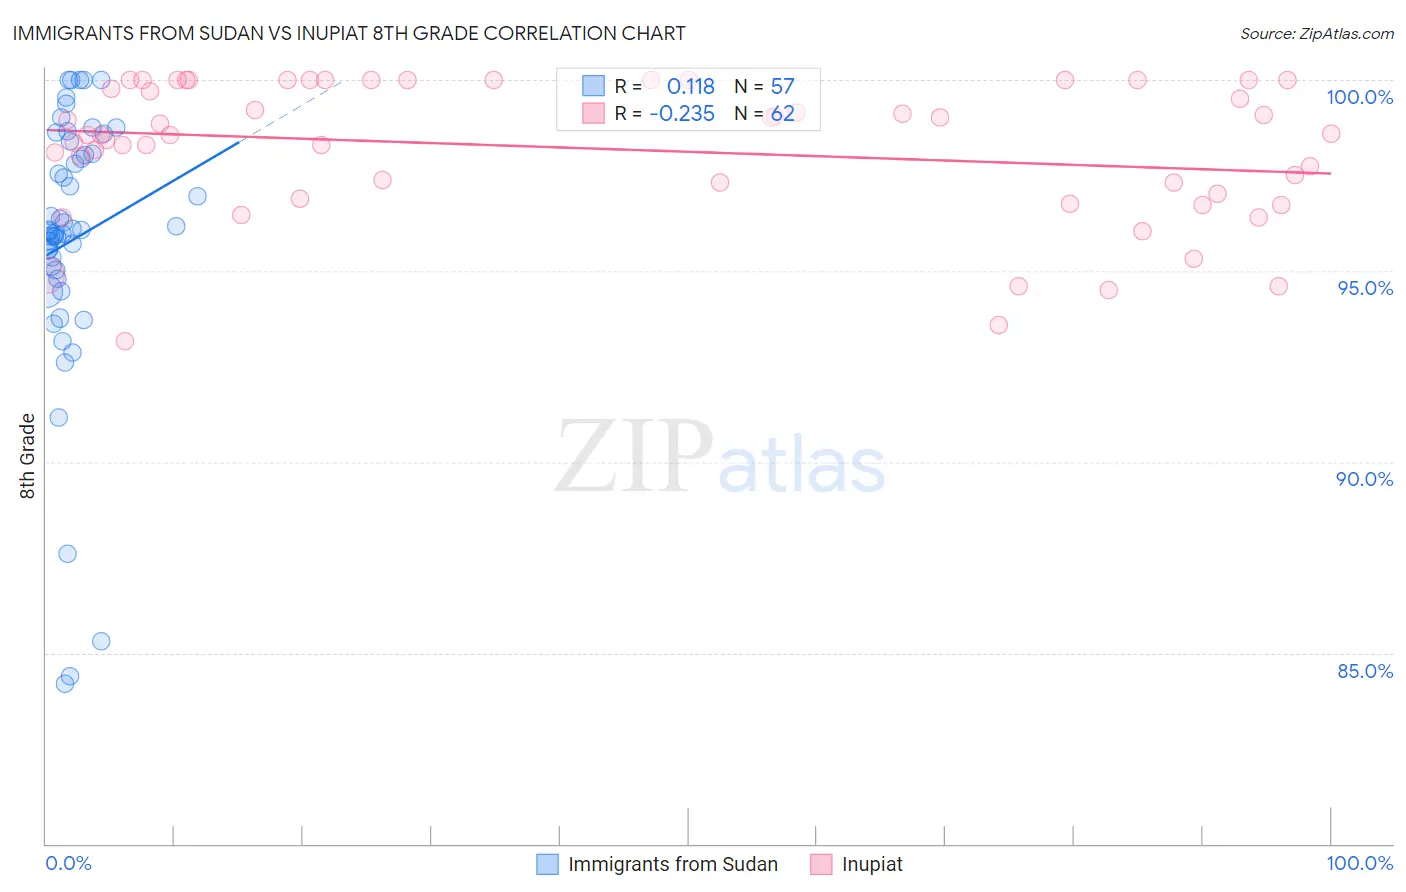
Immigrants from Sudan vs Inupiat 8th Grade Correlation Chart
The statistical analysis conducted on geographies consisting of 118,959,807 people shows a poor positive correlation between the proportion of Immigrants from Sudan and percentage of population with at least 8th grade education in the United States with a correlation coefficient (R) of 0.118 and weighted average of 95.5%. Similarly, the statistical analysis conducted on geographies consisting of 96,348,974 people shows a weak negative correlation between the proportion of Inupiat and percentage of population with at least 8th grade education in the United States with a correlation coefficient (R) of -0.235 and weighted average of 97.0%, a difference of 1.6%.
8th Grade Correlation Summary
| Measurement | Immigrants from Sudan | Inupiat |
| Minimum | 84.2% | 93.2% |
| Maximum | 100.0% | 100.0% |
| Range | 15.8% | 6.8% |
| Mean | 95.8% | 98.2% |
| Median | 96.1% | 98.6% |
| Interquartile 25% (IQ1) | 94.9% | 97.0% |
| Interquartile 75% (IQ3) | 98.2% | 100.0% |
| Interquartile Range (IQR) | 3.3% | 3.0% |
| Standard Deviation (Sample) | 3.6% | 1.8% |
| Standard Deviation (Population) | 3.5% | 1.8% |
Similar Demographics by 8th Grade
Demographics Similar to Immigrants from Sudan by 8th Grade
In terms of 8th grade, the demographic groups most similar to Immigrants from Sudan are Portuguese (95.5%, a difference of 0.010%), Hawaiian (95.5%, a difference of 0.020%), Immigrants from Bahamas (95.5%, a difference of 0.020%), Comanche (95.5%, a difference of 0.020%), and Immigrants from Lebanon (95.4%, a difference of 0.020%).
| Demographics | Rating | Rank | 8th Grade |
| Argentineans | 22.2 /100 | #200 | Fair 95.5% |
| Immigrants | Argentina | 20.6 /100 | #201 | Fair 95.5% |
| Apache | 19.4 /100 | #202 | Poor 95.5% |
| Moroccans | 17.4 /100 | #203 | Poor 95.5% |
| Hawaiians | 16.7 /100 | #204 | Poor 95.5% |
| Immigrants | Bahamas | 16.7 /100 | #205 | Poor 95.5% |
| Comanche | 16.3 /100 | #206 | Poor 95.5% |
| Immigrants | Sudan | 15.1 /100 | #207 | Poor 95.5% |
| Portuguese | 14.3 /100 | #208 | Poor 95.5% |
| Immigrants | Lebanon | 13.7 /100 | #209 | Poor 95.4% |
| Africans | 13.6 /100 | #210 | Poor 95.4% |
| Immigrants | Morocco | 12.4 /100 | #211 | Poor 95.4% |
| Immigrants | Pakistan | 9.7 /100 | #212 | Tragic 95.4% |
| Laotians | 9.0 /100 | #213 | Tragic 95.4% |
| Immigrants | Chile | 9.0 /100 | #214 | Tragic 95.4% |
Demographics Similar to Inupiat by 8th Grade
In terms of 8th grade, the demographic groups most similar to Inupiat are Eastern European (97.0%, a difference of 0.0%), Hungarian (97.0%, a difference of 0.010%), British (97.0%, a difference of 0.020%), Latvian (97.0%, a difference of 0.030%), and Alaska Native (97.0%, a difference of 0.040%).
| Demographics | Rating | Rank | 8th Grade |
| Swiss | 100.0 /100 | #33 | Exceptional 97.0% |
| Luxembourgers | 100.0 /100 | #34 | Exceptional 97.0% |
| Alaska Natives | 100.0 /100 | #35 | Exceptional 97.0% |
| Belgians | 100.0 /100 | #36 | Exceptional 97.0% |
| Latvians | 100.0 /100 | #37 | Exceptional 97.0% |
| British | 100.0 /100 | #38 | Exceptional 97.0% |
| Hungarians | 100.0 /100 | #39 | Exceptional 97.0% |
| Inupiat | 100.0 /100 | #40 | Exceptional 97.0% |
| Eastern Europeans | 100.0 /100 | #41 | Exceptional 97.0% |
| Chinese | 100.0 /100 | #42 | Exceptional 96.9% |
| Aleuts | 99.9 /100 | #43 | Exceptional 96.9% |
| Maltese | 99.9 /100 | #44 | Exceptional 96.9% |
| Northern Europeans | 99.9 /100 | #45 | Exceptional 96.9% |
| Czechoslovakians | 99.9 /100 | #46 | Exceptional 96.9% |
| Bulgarians | 99.9 /100 | #47 | Exceptional 96.9% |