Immigrants from Sri Lanka vs Immigrants from Caribbean Unemployment
COMPARE
Immigrants from Sri Lanka
Immigrants from Caribbean
Unemployment
Unemployment Comparison
Immigrants from Sri Lanka
Immigrants from Caribbean
5.1%
UNEMPLOYMENT
91.1/ 100
METRIC RATING
116th/ 347
METRIC RANK
6.2%
UNEMPLOYMENT
0.0/ 100
METRIC RATING
286th/ 347
METRIC RANK
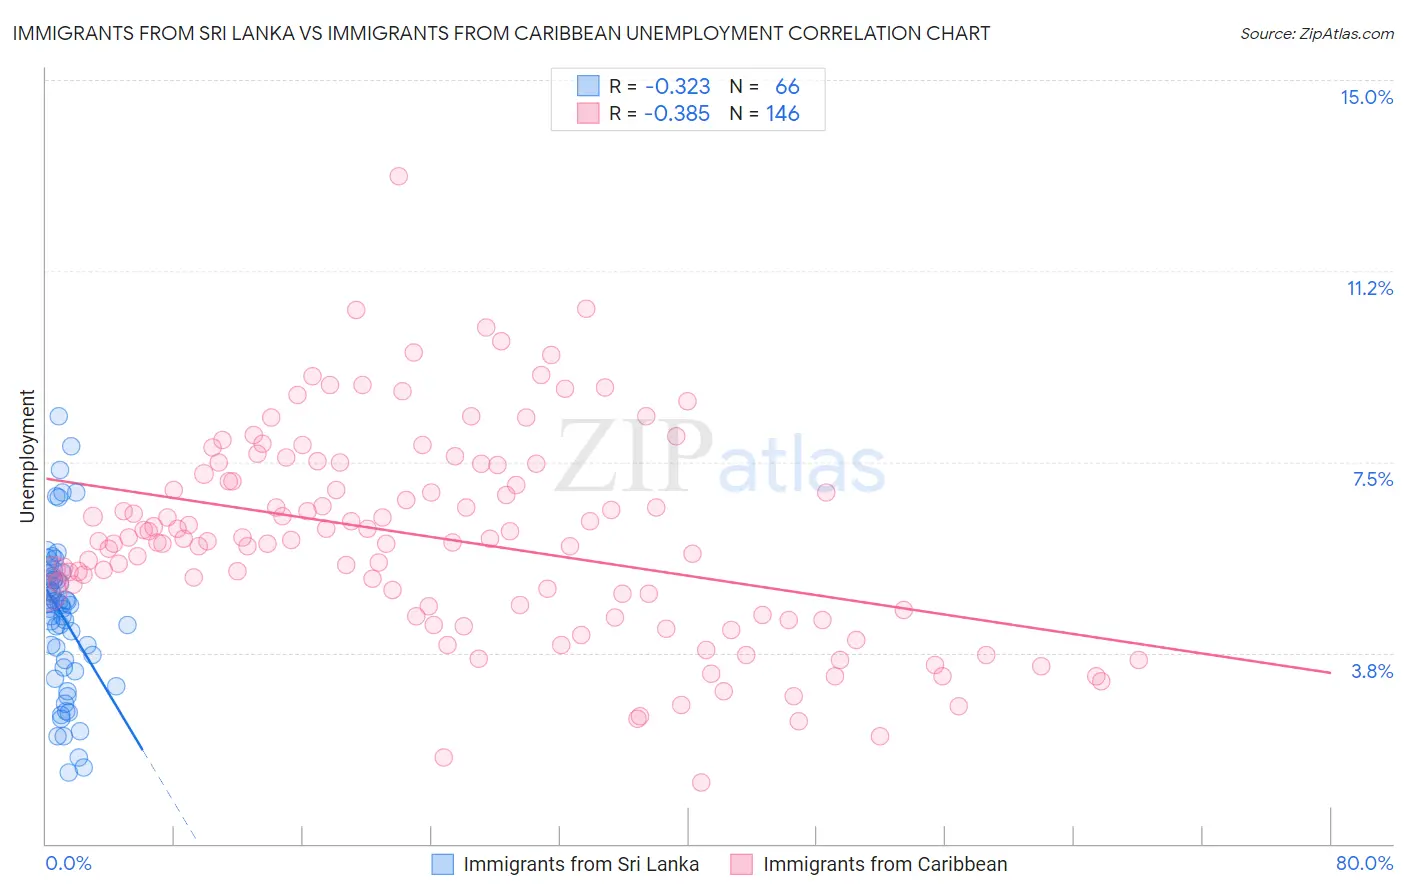
Immigrants from Sri Lanka vs Immigrants from Caribbean Unemployment Correlation Chart
The statistical analysis conducted on geographies consisting of 149,679,955 people shows a mild negative correlation between the proportion of Immigrants from Sri Lanka and unemployment in the United States with a correlation coefficient (R) of -0.323 and weighted average of 5.1%. Similarly, the statistical analysis conducted on geographies consisting of 449,366,632 people shows a mild negative correlation between the proportion of Immigrants from Caribbean and unemployment in the United States with a correlation coefficient (R) of -0.385 and weighted average of 6.2%, a difference of 21.4%.
Unemployment Correlation Summary
| Measurement | Immigrants from Sri Lanka | Immigrants from Caribbean |
| Minimum | 1.4% | 1.2% |
| Maximum | 8.4% | 13.1% |
| Range | 7.0% | 11.9% |
| Mean | 4.5% | 6.0% |
| Median | 4.7% | 6.0% |
| Interquartile 25% (IQ1) | 3.5% | 4.6% |
| Interquartile 75% (IQ3) | 5.2% | 7.3% |
| Interquartile Range (IQR) | 1.8% | 2.7% |
| Standard Deviation (Sample) | 1.5% | 2.0% |
| Standard Deviation (Population) | 1.5% | 2.0% |
Similar Demographics by Unemployment
Demographics Similar to Immigrants from Sri Lanka by Unemployment
In terms of unemployment, the demographic groups most similar to Immigrants from Sri Lanka are Immigrants from Western Europe (5.1%, a difference of 0.010%), Immigrants from Malaysia (5.1%, a difference of 0.020%), Immigrants from Germany (5.1%, a difference of 0.050%), Immigrants from Ireland (5.1%, a difference of 0.22%), and Immigrants from France (5.1%, a difference of 0.26%).
| Demographics | Rating | Rank | Unemployment |
| Immigrants | Eritrea | 93.3 /100 | #109 | Exceptional 5.0% |
| Immigrants | Lithuania | 93.2 /100 | #110 | Exceptional 5.0% |
| Chileans | 93.2 /100 | #111 | Exceptional 5.0% |
| South Africans | 92.6 /100 | #112 | Exceptional 5.1% |
| Argentineans | 92.4 /100 | #113 | Exceptional 5.1% |
| Immigrants | Ireland | 92.1 /100 | #114 | Exceptional 5.1% |
| Immigrants | Western Europe | 91.1 /100 | #115 | Exceptional 5.1% |
| Immigrants | Sri Lanka | 91.1 /100 | #116 | Exceptional 5.1% |
| Immigrants | Malaysia | 91.0 /100 | #117 | Exceptional 5.1% |
| Immigrants | Germany | 90.8 /100 | #118 | Exceptional 5.1% |
| Immigrants | France | 89.7 /100 | #119 | Excellent 5.1% |
| Macedonians | 89.7 /100 | #120 | Excellent 5.1% |
| Lebanese | 89.2 /100 | #121 | Excellent 5.1% |
| Immigrants | Switzerland | 89.1 /100 | #122 | Excellent 5.1% |
| Asians | 89.0 /100 | #123 | Excellent 5.1% |
Demographics Similar to Immigrants from Caribbean by Unemployment
In terms of unemployment, the demographic groups most similar to Immigrants from Caribbean are Nepalese (6.2%, a difference of 0.33%), Ecuadorian (6.2%, a difference of 0.36%), Immigrants from Senegal (6.1%, a difference of 0.43%), Chippewa (6.2%, a difference of 0.71%), and Senegalese (6.2%, a difference of 0.80%).
| Demographics | Rating | Rank | Unemployment |
| Immigrants | Mexico | 0.0 /100 | #279 | Tragic 6.0% |
| Immigrants | Western Africa | 0.0 /100 | #280 | Tragic 6.0% |
| Africans | 0.0 /100 | #281 | Tragic 6.1% |
| Immigrants | Azores | 0.0 /100 | #282 | Tragic 6.1% |
| Immigrants | Ghana | 0.0 /100 | #283 | Tragic 6.1% |
| Aleuts | 0.0 /100 | #284 | Tragic 6.1% |
| Immigrants | Senegal | 0.0 /100 | #285 | Tragic 6.1% |
| Immigrants | Caribbean | 0.0 /100 | #286 | Tragic 6.2% |
| Nepalese | 0.0 /100 | #287 | Tragic 6.2% |
| Ecuadorians | 0.0 /100 | #288 | Tragic 6.2% |
| Chippewa | 0.0 /100 | #289 | Tragic 6.2% |
| Senegalese | 0.0 /100 | #290 | Tragic 6.2% |
| Haitians | 0.0 /100 | #291 | Tragic 6.2% |
| Central American Indians | 0.0 /100 | #292 | Tragic 6.2% |
| Immigrants | Ecuador | 0.0 /100 | #293 | Tragic 6.2% |