Immigrants from Sri Lanka vs French Canadian Unemployment Among Ages 55 to 59 years
COMPARE
Immigrants from Sri Lanka
French Canadian
Unemployment Among Ages 55 to 59 years
Unemployment Among Ages 55 to 59 years Comparison
Immigrants from Sri Lanka
French Canadians
4.8%
UNEMPLOYMENT AMONG AGES 55 TO 59 YEARS
46.8/ 100
METRIC RATING
177th/ 347
METRIC RANK
4.8%
UNEMPLOYMENT AMONG AGES 55 TO 59 YEARS
80.1/ 100
METRIC RATING
141st/ 347
METRIC RANK
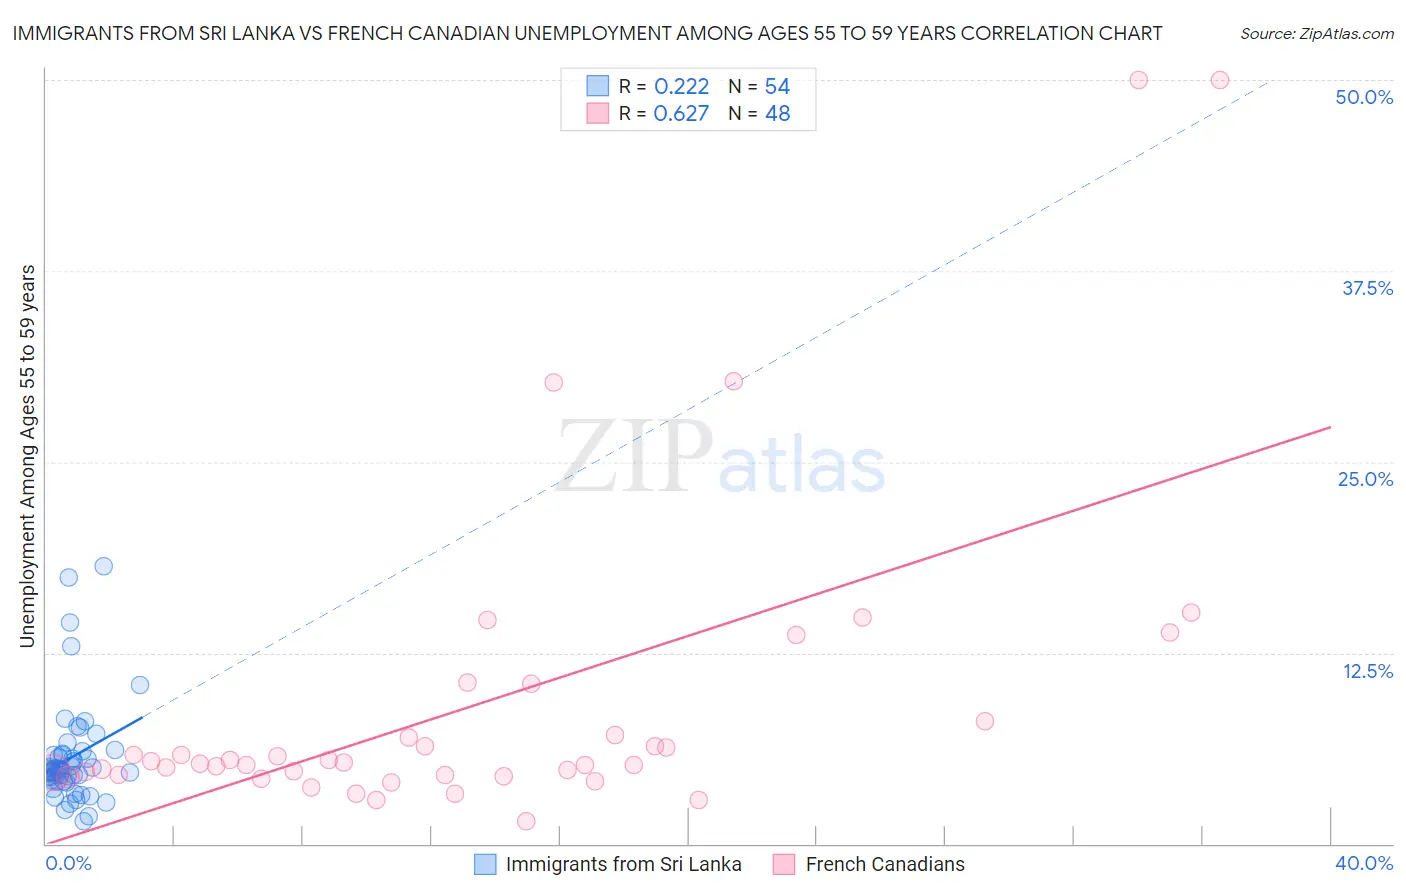
Immigrants from Sri Lanka vs French Canadian Unemployment Among Ages 55 to 59 years Correlation Chart
The statistical analysis conducted on geographies consisting of 145,961,624 people shows a weak positive correlation between the proportion of Immigrants from Sri Lanka and unemployment rate among population between the ages 55 and 59 in the United States with a correlation coefficient (R) of 0.222 and weighted average of 4.8%. Similarly, the statistical analysis conducted on geographies consisting of 444,972,428 people shows a significant positive correlation between the proportion of French Canadians and unemployment rate among population between the ages 55 and 59 in the United States with a correlation coefficient (R) of 0.627 and weighted average of 4.8%, a difference of 1.6%.
Unemployment Among Ages 55 to 59 years Correlation Summary
| Measurement | Immigrants from Sri Lanka | French Canadian |
| Minimum | 1.5% | 1.5% |
| Maximum | 18.2% | 50.0% |
| Range | 16.7% | 48.5% |
| Mean | 5.7% | 9.1% |
| Median | 4.8% | 5.3% |
| Interquartile 25% (IQ1) | 4.1% | 4.5% |
| Interquartile 75% (IQ3) | 5.9% | 7.5% |
| Interquartile Range (IQR) | 1.8% | 3.0% |
| Standard Deviation (Sample) | 3.4% | 10.4% |
| Standard Deviation (Population) | 3.3% | 10.3% |
Similar Demographics by Unemployment Among Ages 55 to 59 years
Demographics Similar to Immigrants from Sri Lanka by Unemployment Among Ages 55 to 59 years
In terms of unemployment among ages 55 to 59 years, the demographic groups most similar to Immigrants from Sri Lanka are Samoan (4.8%, a difference of 0.010%), Australian (4.8%, a difference of 0.070%), Arab (4.8%, a difference of 0.090%), Hungarian (4.8%, a difference of 0.10%), and South American (4.8%, a difference of 0.12%).
| Demographics | Rating | Rank | Unemployment Among Ages 55 to 59 years |
| Uruguayans | 55.6 /100 | #170 | Average 4.8% |
| Japanese | 54.5 /100 | #171 | Average 4.8% |
| Nicaraguans | 54.0 /100 | #172 | Average 4.8% |
| Immigrants | Eastern Europe | 52.2 /100 | #173 | Average 4.8% |
| Immigrants | Croatia | 50.0 /100 | #174 | Average 4.8% |
| Australians | 48.6 /100 | #175 | Average 4.8% |
| Samoans | 47.1 /100 | #176 | Average 4.8% |
| Immigrants | Sri Lanka | 46.8 /100 | #177 | Average 4.8% |
| Arabs | 44.7 /100 | #178 | Average 4.8% |
| Hungarians | 44.3 /100 | #179 | Average 4.8% |
| South Americans | 44.0 /100 | #180 | Average 4.8% |
| Immigrants | Hungary | 40.4 /100 | #181 | Average 4.8% |
| Immigrants | Europe | 40.4 /100 | #182 | Average 4.8% |
| Immigrants | Peru | 38.6 /100 | #183 | Fair 4.8% |
| Immigrants | Czechoslovakia | 38.0 /100 | #184 | Fair 4.8% |
Demographics Similar to French Canadians by Unemployment Among Ages 55 to 59 years
In terms of unemployment among ages 55 to 59 years, the demographic groups most similar to French Canadians are Immigrants from Indonesia (4.8%, a difference of 0.010%), Immigrants from Norway (4.8%, a difference of 0.020%), Ukrainian (4.8%, a difference of 0.090%), Immigrants from Asia (4.8%, a difference of 0.14%), and Immigrants from Northern Europe (4.8%, a difference of 0.16%).
| Demographics | Rating | Rank | Unemployment Among Ages 55 to 59 years |
| Panamanians | 84.1 /100 | #134 | Excellent 4.7% |
| Slavs | 83.7 /100 | #135 | Excellent 4.7% |
| Colombians | 83.6 /100 | #136 | Excellent 4.7% |
| Delaware | 83.6 /100 | #137 | Excellent 4.7% |
| Immigrants | Switzerland | 82.9 /100 | #138 | Excellent 4.7% |
| Romanians | 82.7 /100 | #139 | Excellent 4.7% |
| Immigrants | Indonesia | 80.2 /100 | #140 | Excellent 4.8% |
| French Canadians | 80.1 /100 | #141 | Excellent 4.8% |
| Immigrants | Norway | 79.8 /100 | #142 | Good 4.8% |
| Ukrainians | 78.6 /100 | #143 | Good 4.8% |
| Immigrants | Asia | 77.8 /100 | #144 | Good 4.8% |
| Immigrants | Northern Europe | 77.5 /100 | #145 | Good 4.8% |
| Immigrants | South Eastern Asia | 77.4 /100 | #146 | Good 4.8% |
| Immigrants | Singapore | 76.6 /100 | #147 | Good 4.8% |
| Immigrants | Bahamas | 71.8 /100 | #148 | Good 4.8% |