Immigrants from Spain vs Yuman Disability
COMPARE
Immigrants from Spain
Yuman
Disability
Disability Comparison
Immigrants from Spain
Yuman
10.9%
DISABILITY
99.8/ 100
METRIC RATING
53rd/ 347
METRIC RANK
14.6%
DISABILITY
0.0/ 100
METRIC RATING
334th/ 347
METRIC RANK
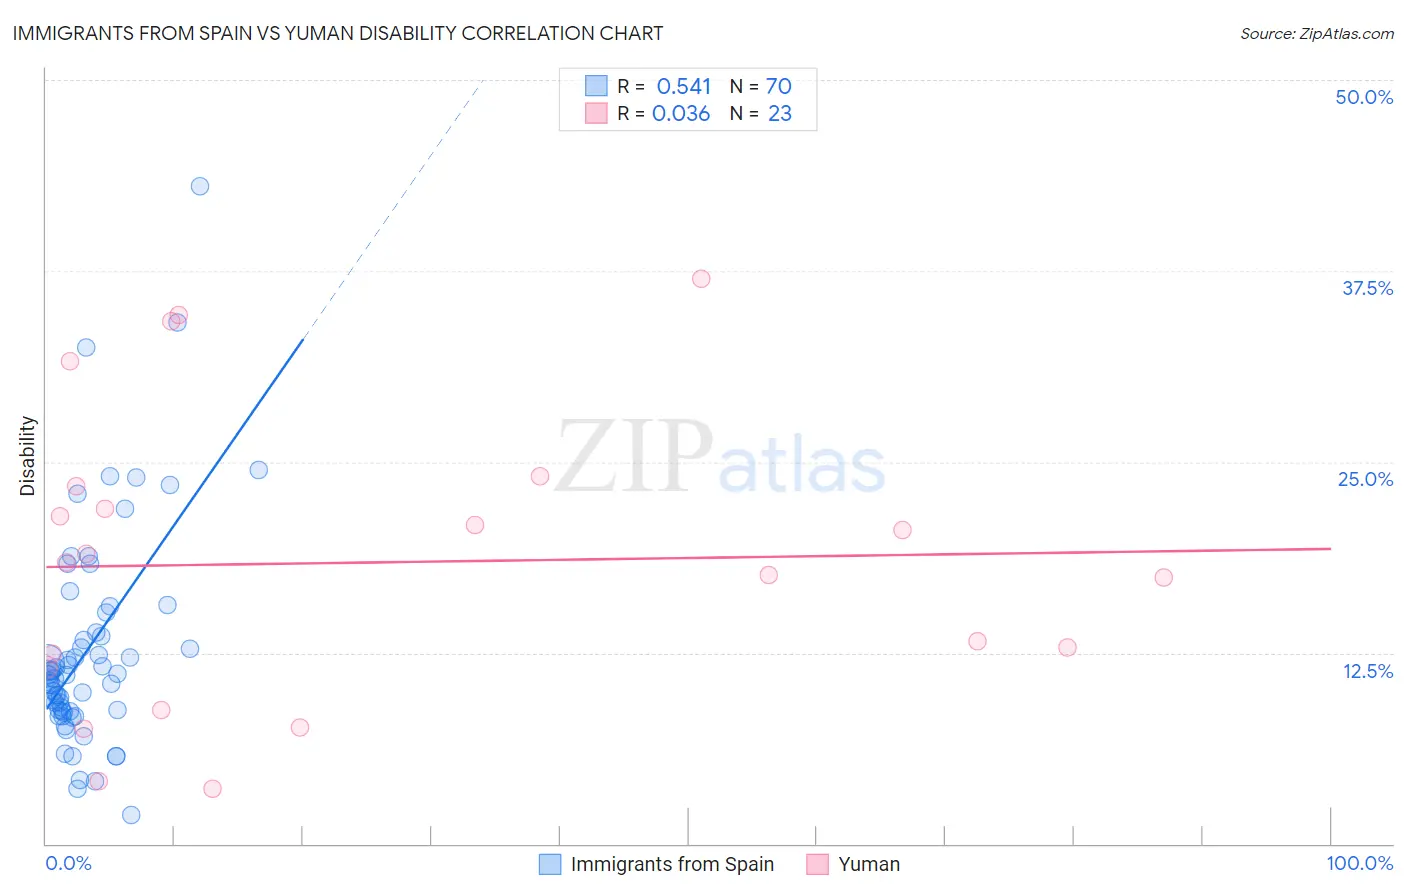
Immigrants from Spain vs Yuman Disability Correlation Chart
The statistical analysis conducted on geographies consisting of 239,685,180 people shows a substantial positive correlation between the proportion of Immigrants from Spain and percentage of population with a disability in the United States with a correlation coefficient (R) of 0.541 and weighted average of 10.9%. Similarly, the statistical analysis conducted on geographies consisting of 40,663,643 people shows no correlation between the proportion of Yuman and percentage of population with a disability in the United States with a correlation coefficient (R) of 0.036 and weighted average of 14.6%, a difference of 34.5%.
Disability Correlation Summary
| Measurement | Immigrants from Spain | Yuman |
| Minimum | 1.9% | 3.6% |
| Maximum | 43.1% | 37.0% |
| Range | 41.2% | 33.4% |
| Mean | 12.7% | 18.4% |
| Median | 11.0% | 18.4% |
| Interquartile 25% (IQ1) | 8.7% | 11.6% |
| Interquartile 75% (IQ3) | 13.8% | 23.4% |
| Interquartile Range (IQR) | 5.1% | 11.8% |
| Standard Deviation (Sample) | 7.2% | 9.6% |
| Standard Deviation (Population) | 7.1% | 9.4% |
Similar Demographics by Disability
Demographics Similar to Immigrants from Spain by Disability
In terms of disability, the demographic groups most similar to Immigrants from Spain are Jordanian (10.9%, a difference of 0.0%), South American (10.9%, a difference of 0.020%), Peruvian (10.9%, a difference of 0.080%), Vietnamese (10.9%, a difference of 0.090%), and Immigrants from Saudi Arabia (10.9%, a difference of 0.090%).
| Demographics | Rating | Rank | Disability |
| Tongans | 99.9 /100 | #46 | Exceptional 10.8% |
| Taiwanese | 99.9 /100 | #47 | Exceptional 10.8% |
| Soviet Union | 99.9 /100 | #48 | Exceptional 10.9% |
| Vietnamese | 99.9 /100 | #49 | Exceptional 10.9% |
| Immigrants | Saudi Arabia | 99.9 /100 | #50 | Exceptional 10.9% |
| Peruvians | 99.8 /100 | #51 | Exceptional 10.9% |
| South Americans | 99.8 /100 | #52 | Exceptional 10.9% |
| Immigrants | Spain | 99.8 /100 | #53 | Exceptional 10.9% |
| Jordanians | 99.8 /100 | #54 | Exceptional 10.9% |
| Immigrants | El Salvador | 99.8 /100 | #55 | Exceptional 10.9% |
| Immigrants | Lithuania | 99.8 /100 | #56 | Exceptional 10.9% |
| Salvadorans | 99.8 /100 | #57 | Exceptional 10.9% |
| Immigrants | South America | 99.8 /100 | #58 | Exceptional 10.9% |
| Immigrants | Colombia | 99.7 /100 | #59 | Exceptional 10.9% |
| Zimbabweans | 99.7 /100 | #60 | Exceptional 10.9% |
Demographics Similar to Yuman by Disability
In terms of disability, the demographic groups most similar to Yuman are Cajun (14.6%, a difference of 0.12%), Tohono O'odham (14.8%, a difference of 1.0%), Pueblo (14.4%, a difference of 1.2%), Alaskan Athabascan (14.4%, a difference of 1.2%), and Cherokee (14.8%, a difference of 1.5%).
| Demographics | Rating | Rank | Disability |
| Ottawa | 0.0 /100 | #327 | Tragic 14.2% |
| Immigrants | Azores | 0.0 /100 | #328 | Tragic 14.2% |
| Potawatomi | 0.0 /100 | #329 | Tragic 14.2% |
| Navajo | 0.0 /100 | #330 | Tragic 14.3% |
| Alaskan Athabascans | 0.0 /100 | #331 | Tragic 14.4% |
| Pueblo | 0.0 /100 | #332 | Tragic 14.4% |
| Cajuns | 0.0 /100 | #333 | Tragic 14.6% |
| Yuman | 0.0 /100 | #334 | Tragic 14.6% |
| Tohono O'odham | 0.0 /100 | #335 | Tragic 14.8% |
| Cherokee | 0.0 /100 | #336 | Tragic 14.8% |
| Seminole | 0.0 /100 | #337 | Tragic 14.9% |
| Dutch West Indians | 0.0 /100 | #338 | Tragic 14.9% |
| Chickasaw | 0.0 /100 | #339 | Tragic 15.2% |
| Choctaw | 0.0 /100 | #340 | Tragic 15.4% |
| Lumbee | 0.0 /100 | #341 | Tragic 15.5% |