Immigrants from Spain vs Immigrants from Eastern Europe Single Father Households
COMPARE
Immigrants from Spain
Immigrants from Eastern Europe
Single Father Households
Single Father Households Comparison
Immigrants from Spain
Immigrants from Eastern Europe
2.1%
SINGLE FATHER HOUSEHOLDS
99.8/ 100
METRIC RATING
72nd/ 347
METRIC RANK
2.0%
SINGLE FATHER HOUSEHOLDS
100.0/ 100
METRIC RATING
38th/ 347
METRIC RANK
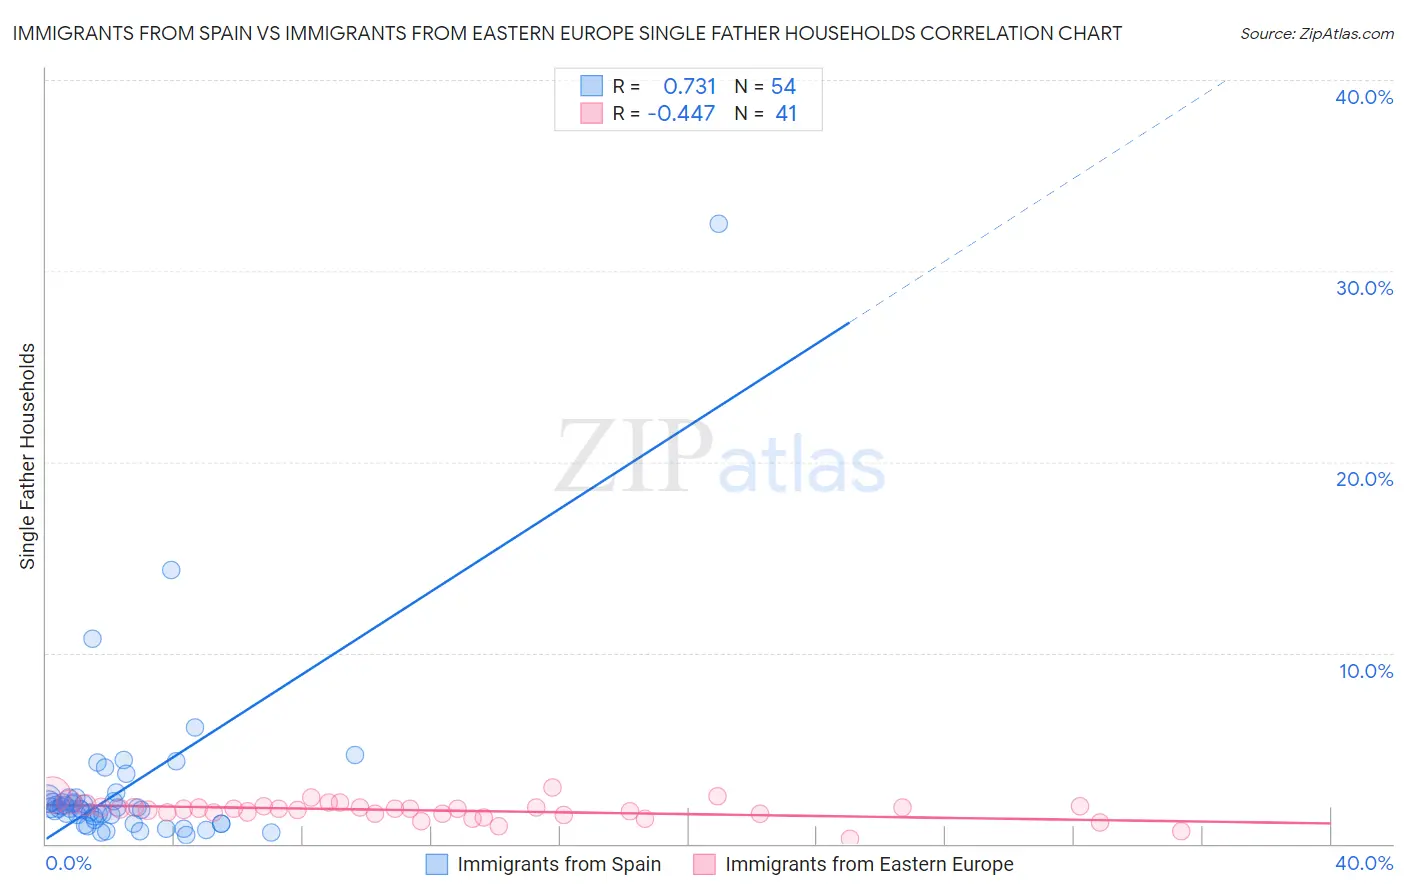
Immigrants from Spain vs Immigrants from Eastern Europe Single Father Households Correlation Chart
The statistical analysis conducted on geographies consisting of 238,550,854 people shows a strong positive correlation between the proportion of Immigrants from Spain and percentage of single father households in the United States with a correlation coefficient (R) of 0.731 and weighted average of 2.1%. Similarly, the statistical analysis conducted on geographies consisting of 469,396,556 people shows a moderate negative correlation between the proportion of Immigrants from Eastern Europe and percentage of single father households in the United States with a correlation coefficient (R) of -0.447 and weighted average of 2.0%, a difference of 3.8%.
Single Father Households Correlation Summary
| Measurement | Immigrants from Spain | Immigrants from Eastern Europe |
| Minimum | 0.45% | 0.23% |
| Maximum | 32.5% | 2.9% |
| Range | 32.0% | 2.7% |
| Mean | 2.9% | 1.7% |
| Median | 1.9% | 1.8% |
| Interquartile 25% (IQ1) | 1.3% | 1.6% |
| Interquartile 75% (IQ3) | 2.4% | 1.9% |
| Interquartile Range (IQR) | 1.1% | 0.37% |
| Standard Deviation (Sample) | 4.7% | 0.49% |
| Standard Deviation (Population) | 4.7% | 0.48% |
Similar Demographics by Single Father Households
Demographics Similar to Immigrants from Spain by Single Father Households
In terms of single father households, the demographic groups most similar to Immigrants from Spain are Immigrants from Kuwait (2.1%, a difference of 0.0%), Egyptian (2.1%, a difference of 0.020%), Immigrants from Bangladesh (2.1%, a difference of 0.14%), Immigrants from Egypt (2.1%, a difference of 0.15%), and Immigrants from Romania (2.1%, a difference of 0.22%).
| Demographics | Rating | Rank | Single Father Households |
| Paraguayans | 99.9 /100 | #65 | Exceptional 2.1% |
| Immigrants | Western Asia | 99.8 /100 | #66 | Exceptional 2.1% |
| Immigrants | Italy | 99.8 /100 | #67 | Exceptional 2.1% |
| Immigrants | Denmark | 99.8 /100 | #68 | Exceptional 2.1% |
| Immigrants | Romania | 99.8 /100 | #69 | Exceptional 2.1% |
| Egyptians | 99.8 /100 | #70 | Exceptional 2.1% |
| Immigrants | Kuwait | 99.8 /100 | #71 | Exceptional 2.1% |
| Immigrants | Spain | 99.8 /100 | #72 | Exceptional 2.1% |
| Immigrants | Bangladesh | 99.8 /100 | #73 | Exceptional 2.1% |
| Immigrants | Egypt | 99.8 /100 | #74 | Exceptional 2.1% |
| Immigrants | Sweden | 99.8 /100 | #75 | Exceptional 2.1% |
| Immigrants | Scotland | 99.8 /100 | #76 | Exceptional 2.1% |
| Immigrants | Saudi Arabia | 99.8 /100 | #77 | Exceptional 2.1% |
| Estonians | 99.7 /100 | #78 | Exceptional 2.1% |
| Immigrants | Asia | 99.7 /100 | #79 | Exceptional 2.1% |
Demographics Similar to Immigrants from Eastern Europe by Single Father Households
In terms of single father households, the demographic groups most similar to Immigrants from Eastern Europe are Immigrants from Sri Lanka (2.0%, a difference of 0.0%), Immigrants from Bulgaria (2.0%, a difference of 0.050%), Immigrants from Turkey (2.0%, a difference of 0.23%), Immigrants from St. Vincent and the Grenadines (2.0%, a difference of 0.30%), and Immigrants from Belgium (2.0%, a difference of 0.32%).
| Demographics | Rating | Rank | Single Father Households |
| Israelis | 100.0 /100 | #31 | Exceptional 2.0% |
| Chinese | 100.0 /100 | #32 | Exceptional 2.0% |
| Turks | 100.0 /100 | #33 | Exceptional 2.0% |
| Immigrants | Australia | 100.0 /100 | #34 | Exceptional 2.0% |
| Albanians | 100.0 /100 | #35 | Exceptional 2.0% |
| Immigrants | Belgium | 100.0 /100 | #36 | Exceptional 2.0% |
| Immigrants | St. Vincent and the Grenadines | 100.0 /100 | #37 | Exceptional 2.0% |
| Immigrants | Eastern Europe | 100.0 /100 | #38 | Exceptional 2.0% |
| Immigrants | Sri Lanka | 100.0 /100 | #39 | Exceptional 2.0% |
| Immigrants | Bulgaria | 100.0 /100 | #40 | Exceptional 2.0% |
| Immigrants | Turkey | 100.0 /100 | #41 | Exceptional 2.0% |
| Macedonians | 100.0 /100 | #42 | Exceptional 2.0% |
| Immigrants | Grenada | 100.0 /100 | #43 | Exceptional 2.0% |
| Latvians | 100.0 /100 | #44 | Exceptional 2.0% |
| Russians | 100.0 /100 | #45 | Exceptional 2.0% |