Immigrants from South America vs Immigrants from Eastern Europe Male Unemployment
COMPARE
Immigrants from South America
Immigrants from Eastern Europe
Male Unemployment
Male Unemployment Comparison
Immigrants from South America
Immigrants from Eastern Europe
5.4%
MALE UNEMPLOYMENT
29.4/ 100
METRIC RATING
189th/ 347
METRIC RANK
5.3%
MALE UNEMPLOYMENT
54.1/ 100
METRIC RATING
170th/ 347
METRIC RANK
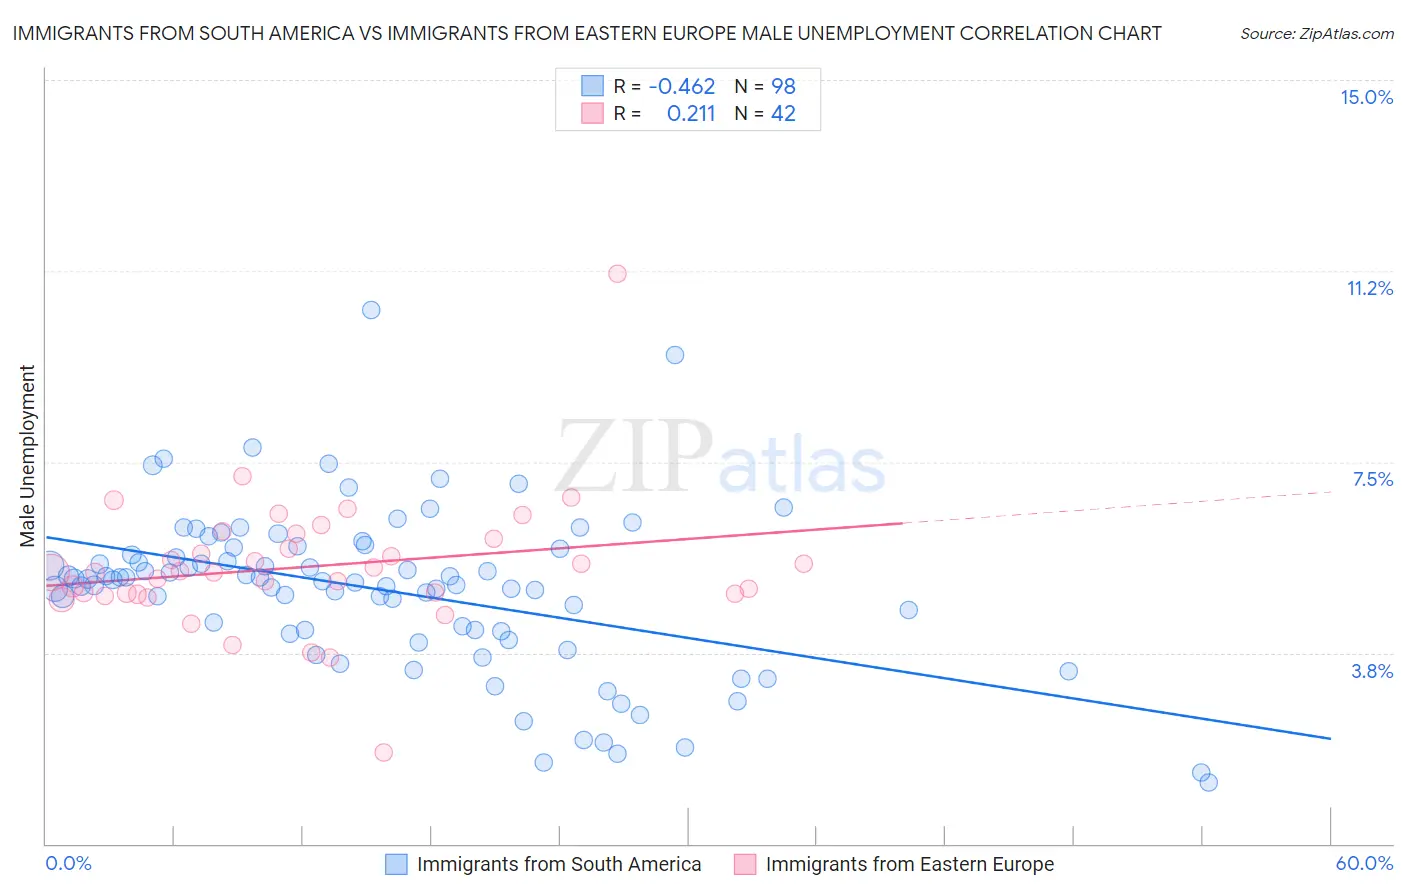
Immigrants from South America vs Immigrants from Eastern Europe Male Unemployment Correlation Chart
The statistical analysis conducted on geographies consisting of 483,078,598 people shows a moderate negative correlation between the proportion of Immigrants from South America and unemployment rate among males in the United States with a correlation coefficient (R) of -0.462 and weighted average of 5.4%. Similarly, the statistical analysis conducted on geographies consisting of 472,485,071 people shows a weak positive correlation between the proportion of Immigrants from Eastern Europe and unemployment rate among males in the United States with a correlation coefficient (R) of 0.211 and weighted average of 5.3%, a difference of 1.5%.
Male Unemployment Correlation Summary
| Measurement | Immigrants from South America | Immigrants from Eastern Europe |
| Minimum | 1.2% | 1.8% |
| Maximum | 10.5% | 11.2% |
| Range | 9.3% | 9.4% |
| Mean | 5.0% | 5.4% |
| Median | 5.2% | 5.3% |
| Interquartile 25% (IQ1) | 4.2% | 4.9% |
| Interquartile 75% (IQ3) | 5.8% | 6.0% |
| Interquartile Range (IQR) | 1.6% | 1.1% |
| Standard Deviation (Sample) | 1.6% | 1.3% |
| Standard Deviation (Population) | 1.6% | 1.3% |
Demographics Similar to Immigrants from South America and Immigrants from Eastern Europe by Male Unemployment
In terms of male unemployment, the demographic groups most similar to Immigrants from South America are Arab (5.4%, a difference of 0.060%), Costa Rican (5.4%, a difference of 0.13%), Iraqi (5.4%, a difference of 0.15%), Korean (5.3%, a difference of 0.37%), and Spaniard (5.3%, a difference of 0.38%). Similarly, the demographic groups most similar to Immigrants from Eastern Europe are Peruvian (5.3%, a difference of 0.13%), Immigrants from Kazakhstan (5.3%, a difference of 0.19%), Immigrants from Congo (5.3%, a difference of 0.20%), Immigrants from Russia (5.3%, a difference of 0.20%), and Immigrants from Iran (5.3%, a difference of 0.24%).
| Demographics | Rating | Rank | Male Unemployment |
| Immigrants | Congo | 57.4 /100 | #169 | Average 5.3% |
| Immigrants | Eastern Europe | 54.1 /100 | #170 | Average 5.3% |
| Peruvians | 51.9 /100 | #171 | Average 5.3% |
| Immigrants | Kazakhstan | 50.8 /100 | #172 | Average 5.3% |
| Immigrants | Russia | 50.7 /100 | #173 | Average 5.3% |
| Immigrants | Iran | 50.0 /100 | #174 | Average 5.3% |
| Immigrants | Iraq | 48.1 /100 | #175 | Average 5.3% |
| Immigrants | Poland | 46.0 /100 | #176 | Average 5.3% |
| Immigrants | Peru | 44.6 /100 | #177 | Average 5.3% |
| Osage | 42.5 /100 | #178 | Average 5.3% |
| Immigrants | Oceania | 40.8 /100 | #179 | Average 5.3% |
| Malaysians | 39.6 /100 | #180 | Fair 5.3% |
| Immigrants | Afghanistan | 37.9 /100 | #181 | Fair 5.3% |
| Potawatomi | 37.8 /100 | #182 | Fair 5.3% |
| Taiwanese | 37.6 /100 | #183 | Fair 5.3% |
| Spaniards | 35.1 /100 | #184 | Fair 5.3% |
| Koreans | 34.9 /100 | #185 | Fair 5.3% |
| Iraqis | 31.6 /100 | #186 | Fair 5.4% |
| Costa Ricans | 31.3 /100 | #187 | Fair 5.4% |
| Arabs | 30.2 /100 | #188 | Fair 5.4% |
| Immigrants | South America | 29.4 /100 | #189 | Fair 5.4% |