Immigrants from South America vs Immigrants from Albania Male Unemployment
COMPARE
Immigrants from South America
Immigrants from Albania
Male Unemployment
Male Unemployment Comparison
Immigrants from South America
Immigrants from Albania
5.4%
MALE UNEMPLOYMENT
29.4/ 100
METRIC RATING
189th/ 347
METRIC RANK
5.5%
MALE UNEMPLOYMENT
3.6/ 100
METRIC RATING
218th/ 347
METRIC RANK
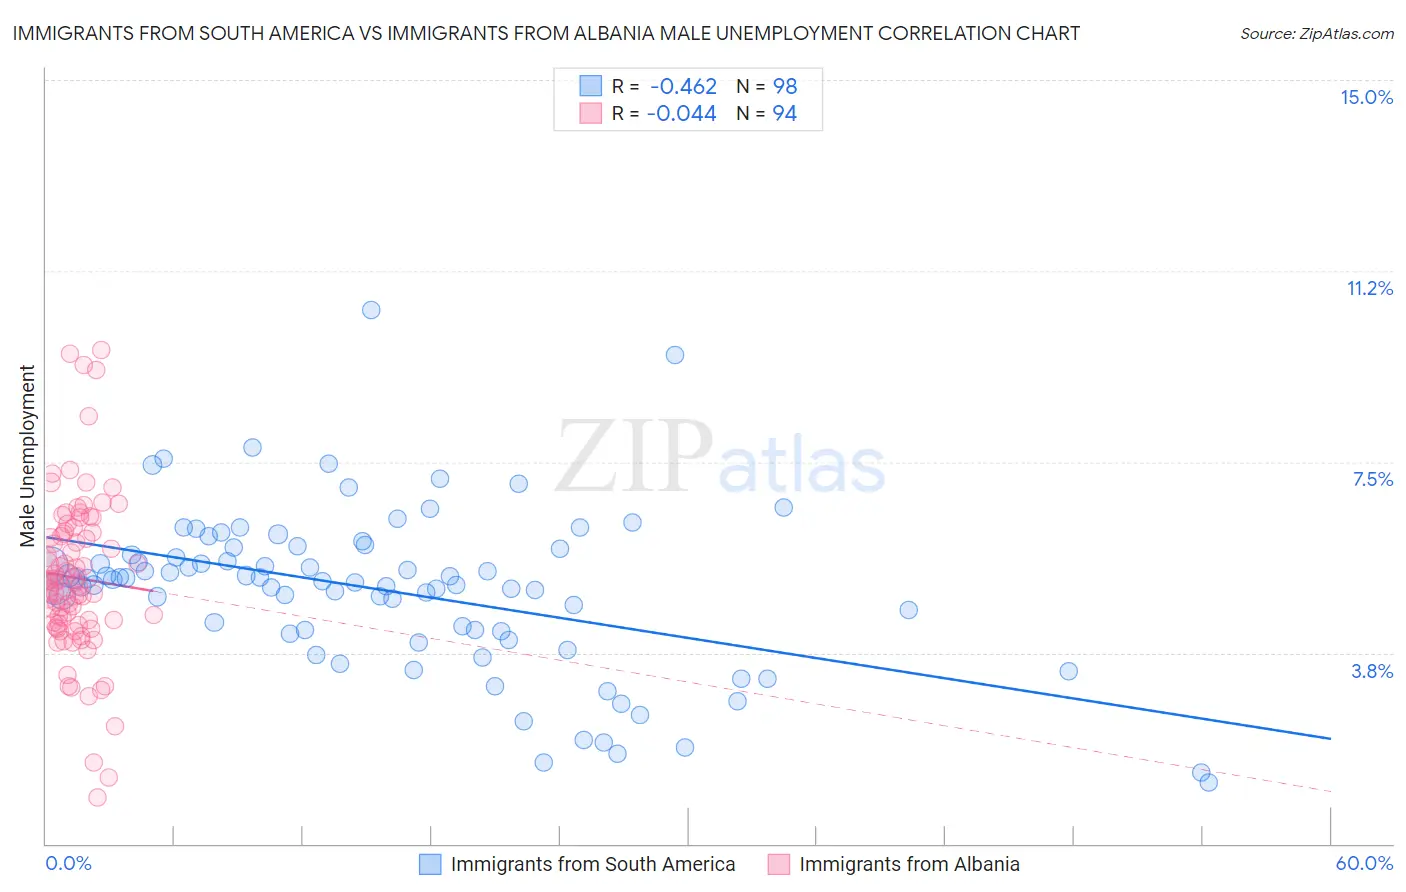
Immigrants from South America vs Immigrants from Albania Male Unemployment Correlation Chart
The statistical analysis conducted on geographies consisting of 483,078,598 people shows a moderate negative correlation between the proportion of Immigrants from South America and unemployment rate among males in the United States with a correlation coefficient (R) of -0.462 and weighted average of 5.4%. Similarly, the statistical analysis conducted on geographies consisting of 119,319,366 people shows no correlation between the proportion of Immigrants from Albania and unemployment rate among males in the United States with a correlation coefficient (R) of -0.044 and weighted average of 5.5%, a difference of 3.5%.
Male Unemployment Correlation Summary
| Measurement | Immigrants from South America | Immigrants from Albania |
| Minimum | 1.2% | 0.90% |
| Maximum | 10.5% | 9.7% |
| Range | 9.3% | 8.8% |
| Mean | 5.0% | 5.2% |
| Median | 5.2% | 5.1% |
| Interquartile 25% (IQ1) | 4.2% | 4.3% |
| Interquartile 75% (IQ3) | 5.8% | 6.1% |
| Interquartile Range (IQR) | 1.6% | 1.8% |
| Standard Deviation (Sample) | 1.6% | 1.6% |
| Standard Deviation (Population) | 1.6% | 1.6% |
Similar Demographics by Male Unemployment
Demographics Similar to Immigrants from South America by Male Unemployment
In terms of male unemployment, the demographic groups most similar to Immigrants from South America are Immigrants from Uganda (5.4%, a difference of 0.040%), Arab (5.4%, a difference of 0.060%), Immigrants from South Eastern Asia (5.4%, a difference of 0.080%), Costa Rican (5.4%, a difference of 0.13%), and Iraqi (5.4%, a difference of 0.15%).
| Demographics | Rating | Rank | Male Unemployment |
| Potawatomi | 37.8 /100 | #182 | Fair 5.3% |
| Taiwanese | 37.6 /100 | #183 | Fair 5.3% |
| Spaniards | 35.1 /100 | #184 | Fair 5.3% |
| Koreans | 34.9 /100 | #185 | Fair 5.3% |
| Iraqis | 31.6 /100 | #186 | Fair 5.4% |
| Costa Ricans | 31.3 /100 | #187 | Fair 5.4% |
| Arabs | 30.2 /100 | #188 | Fair 5.4% |
| Immigrants | South America | 29.4 /100 | #189 | Fair 5.4% |
| Immigrants | Uganda | 28.8 /100 | #190 | Fair 5.4% |
| Immigrants | South Eastern Asia | 28.2 /100 | #191 | Fair 5.4% |
| Immigrants | Belarus | 26.0 /100 | #192 | Fair 5.4% |
| Immigrants | Israel | 25.2 /100 | #193 | Fair 5.4% |
| Spanish | 19.7 /100 | #194 | Poor 5.4% |
| Immigrants | Southern Europe | 17.7 /100 | #195 | Poor 5.4% |
| Albanians | 17.3 /100 | #196 | Poor 5.4% |
Demographics Similar to Immigrants from Albania by Male Unemployment
In terms of male unemployment, the demographic groups most similar to Immigrants from Albania are Immigrants from Western Asia (5.6%, a difference of 0.050%), Portuguese (5.6%, a difference of 0.070%), Soviet Union (5.6%, a difference of 0.18%), Delaware (5.5%, a difference of 0.21%), and Immigrants (5.5%, a difference of 0.26%).
| Demographics | Rating | Rank | Male Unemployment |
| Israelis | 7.4 /100 | #211 | Tragic 5.5% |
| Hmong | 7.0 /100 | #212 | Tragic 5.5% |
| Ugandans | 6.3 /100 | #213 | Tragic 5.5% |
| Puget Sound Salish | 5.6 /100 | #214 | Tragic 5.5% |
| Samoans | 4.9 /100 | #215 | Tragic 5.5% |
| Immigrants | Immigrants | 4.3 /100 | #216 | Tragic 5.5% |
| Delaware | 4.2 /100 | #217 | Tragic 5.5% |
| Immigrants | Albania | 3.6 /100 | #218 | Tragic 5.5% |
| Immigrants | Western Asia | 3.5 /100 | #219 | Tragic 5.6% |
| Portuguese | 3.5 /100 | #220 | Tragic 5.6% |
| Soviet Union | 3.2 /100 | #221 | Tragic 5.6% |
| Immigrants | Micronesia | 2.9 /100 | #222 | Tragic 5.6% |
| Creek | 2.6 /100 | #223 | Tragic 5.6% |
| Cherokee | 2.4 /100 | #224 | Tragic 5.6% |
| Panamanians | 1.9 /100 | #225 | Tragic 5.6% |