Nepalese vs Immigrants from Eastern Europe Male Unemployment
COMPARE
Nepalese
Immigrants from Eastern Europe
Male Unemployment
Male Unemployment Comparison
Nepalese
Immigrants from Eastern Europe
6.4%
MALE UNEMPLOYMENT
0.0/ 100
METRIC RATING
292nd/ 347
METRIC RANK
5.3%
MALE UNEMPLOYMENT
54.1/ 100
METRIC RATING
170th/ 347
METRIC RANK
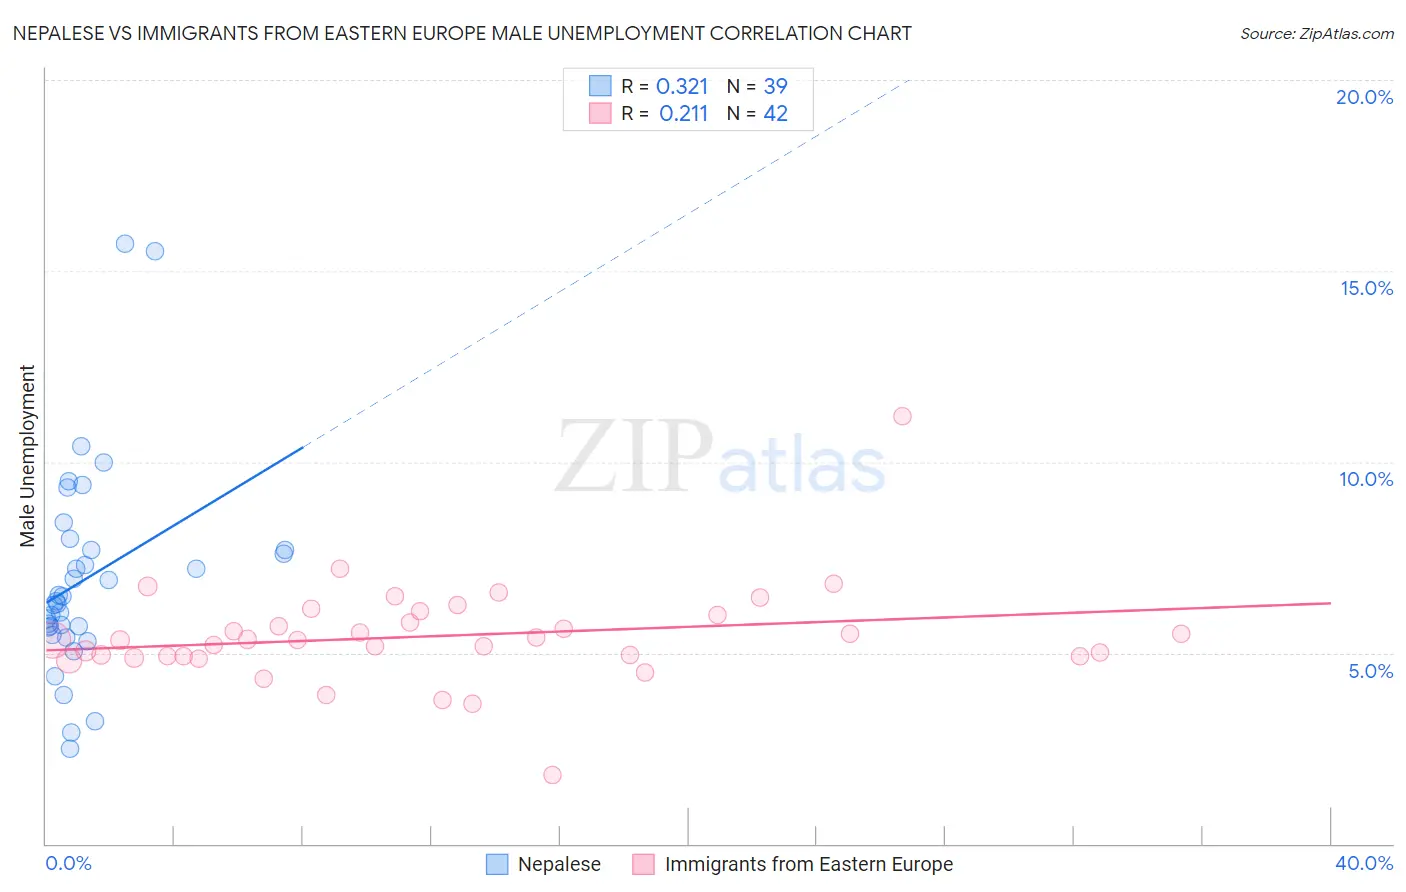
Nepalese vs Immigrants from Eastern Europe Male Unemployment Correlation Chart
The statistical analysis conducted on geographies consisting of 24,511,248 people shows a mild positive correlation between the proportion of Nepalese and unemployment rate among males in the United States with a correlation coefficient (R) of 0.321 and weighted average of 6.4%. Similarly, the statistical analysis conducted on geographies consisting of 472,485,071 people shows a weak positive correlation between the proportion of Immigrants from Eastern Europe and unemployment rate among males in the United States with a correlation coefficient (R) of 0.211 and weighted average of 5.3%, a difference of 21.9%.
Male Unemployment Correlation Summary
| Measurement | Nepalese | Immigrants from Eastern Europe |
| Minimum | 2.5% | 1.8% |
| Maximum | 15.7% | 11.2% |
| Range | 13.2% | 9.4% |
| Mean | 7.0% | 5.4% |
| Median | 6.3% | 5.3% |
| Interquartile 25% (IQ1) | 5.7% | 4.9% |
| Interquartile 75% (IQ3) | 7.7% | 6.0% |
| Interquartile Range (IQR) | 2.0% | 1.1% |
| Standard Deviation (Sample) | 2.7% | 1.3% |
| Standard Deviation (Population) | 2.7% | 1.3% |
Similar Demographics by Male Unemployment
Demographics Similar to Nepalese by Male Unemployment
In terms of male unemployment, the demographic groups most similar to Nepalese are Haitian (6.4%, a difference of 0.030%), Senegalese (6.4%, a difference of 0.14%), Immigrants from the Azores (6.4%, a difference of 0.34%), U.S. Virgin Islander (6.4%, a difference of 0.87%), and Belizean (6.5%, a difference of 0.99%).
| Demographics | Rating | Rank | Male Unemployment |
| Immigrants | Ecuador | 0.0 /100 | #285 | Tragic 6.2% |
| Africans | 0.0 /100 | #286 | Tragic 6.3% |
| Central American Indians | 0.0 /100 | #287 | Tragic 6.3% |
| Immigrants | Senegal | 0.0 /100 | #288 | Tragic 6.3% |
| Immigrants | Caribbean | 0.0 /100 | #289 | Tragic 6.3% |
| U.S. Virgin Islanders | 0.0 /100 | #290 | Tragic 6.4% |
| Immigrants | Azores | 0.0 /100 | #291 | Tragic 6.4% |
| Nepalese | 0.0 /100 | #292 | Tragic 6.4% |
| Haitians | 0.0 /100 | #293 | Tragic 6.4% |
| Senegalese | 0.0 /100 | #294 | Tragic 6.4% |
| Belizeans | 0.0 /100 | #295 | Tragic 6.5% |
| Immigrants | Haiti | 0.0 /100 | #296 | Tragic 6.5% |
| Chippewa | 0.0 /100 | #297 | Tragic 6.6% |
| Jamaicans | 0.0 /100 | #298 | Tragic 6.6% |
| Immigrants | Bangladesh | 0.0 /100 | #299 | Tragic 6.6% |
Demographics Similar to Immigrants from Eastern Europe by Male Unemployment
In terms of male unemployment, the demographic groups most similar to Immigrants from Eastern Europe are Peruvian (5.3%, a difference of 0.13%), Immigrants from Kazakhstan (5.3%, a difference of 0.19%), Immigrants from Congo (5.3%, a difference of 0.20%), Immigrants from Russia (5.3%, a difference of 0.20%), and Immigrants from Ireland (5.3%, a difference of 0.22%).
| Demographics | Rating | Rank | Male Unemployment |
| Immigrants | Hong Kong | 65.7 /100 | #163 | Good 5.2% |
| Afghans | 62.0 /100 | #164 | Good 5.3% |
| South Americans | 60.6 /100 | #165 | Good 5.3% |
| Immigrants | Morocco | 60.2 /100 | #166 | Good 5.3% |
| Immigrants | Vietnam | 58.1 /100 | #167 | Average 5.3% |
| Immigrants | Ireland | 57.7 /100 | #168 | Average 5.3% |
| Immigrants | Congo | 57.4 /100 | #169 | Average 5.3% |
| Immigrants | Eastern Europe | 54.1 /100 | #170 | Average 5.3% |
| Peruvians | 51.9 /100 | #171 | Average 5.3% |
| Immigrants | Kazakhstan | 50.8 /100 | #172 | Average 5.3% |
| Immigrants | Russia | 50.7 /100 | #173 | Average 5.3% |
| Immigrants | Iran | 50.0 /100 | #174 | Average 5.3% |
| Immigrants | Iraq | 48.1 /100 | #175 | Average 5.3% |
| Immigrants | Poland | 46.0 /100 | #176 | Average 5.3% |
| Immigrants | Peru | 44.6 /100 | #177 | Average 5.3% |