Immigrants from South America vs Immigrants from Eastern Europe College, Under 1 year

COMPARE

Immigrants from South America
Race
Ancestry
AfghanAfricanAlaska NativeAlaskan AthabascanAlbanianAleutAlsatianAmericanApacheArabArapahoArgentineanArmenianAssyrian/Chaldean/SyriacAustralianAustrianBahamianBangladeshiBarbadianBasqueBelgianBelizeanBermudanBhutaneseBlackfeetBolivianBrazilianBritishBritish West IndianBulgarianBurmeseCajunCambodianCanadianCape VerdeanCarpatho RusynCelticCentral AmericanCentral American IndianCherokeeCheyenneChickasawChileanChineseChippewaChoctawColombianColvilleComancheCosta RicanCreeCreekCroatianCrowCubanCypriotCzechCzechoslovakianDanishDelawareDominicanDutchDutch West IndianEastern EuropeanEcuadorianEgyptianEnglishEstonianEthiopianEuropeanFijianFilipinoFinnishFrenchFrench American IndianFrench CanadianGermanGerman RussianGhanaianGreekGuamanian/ChamorroGuatemalanGuyaneseHaitianHmongHonduranHopiHoumaHungarianIcelanderIndian (Asian)IndonesianInupiatIranianIraqiIrishIroquoisIsraeliItalianJamaicanJapaneseJordanianKenyanKiowaKoreanLaotianLatvianLebaneseLiberianLithuanianLumbeeLuxembourgerMacedonianMalaysianMalteseMarshalleseMenomineeMexicanMexican American IndianMongolianMoroccanNative HawaiianNavajoNepaleseNew ZealanderNicaraguanNigerianNorthern EuropeanNorwegianOkinawanOsageOttawaPaiutePakistaniPalestinianPanamanianParaguayanPennsylvania GermanPeruvianPimaPolishPortuguesePotawatomiPuebloPuerto RicanPuget Sound SalishRomanianRussianSalvadoranSamoanScandinavianScotch-IrishScottishSeminoleSenegaleseSerbianShoshoneSierra LeoneanSiouxSlavicSlovakSloveneSomaliSouth AfricanSouth AmericanSouth American IndianSoviet UnionSpaniardSpanishSpanish AmericanSpanish American IndianSri LankanSubsaharan AfricanSudaneseSwedishSwissSyrianTaiwaneseThaiTlingit-HaidaTohono O'OdhamTonganTrinidadian and TobagonianTsimshianTurkishU.S. Virgin IslanderUgandanUkrainianUruguayanUteVenezuelanVietnameseWelshWest IndianYakamaYaquiYugoslavianYumanYup'ikZimbabwean
Immigration
NonimmigrantsImmigrantsAfghanistanAfricaAlbaniaArgentinaArmeniaAsiaAustraliaAustriaBahamasBangladeshBarbadosBelarusBelgiumBelizeBoliviaBosnia and HerzegovinaBrazilBulgariaBurma/MyanmarCabo VerdeCambodiaCameroonCanadaCaribbeanCentral AmericaChileChinaColombiaCongoCosta RicaCroatiaCubaCzechoslovakiaDenmarkDominicaDominican RepublicEastern AfricaEastern AsiaEcuadorEgyptEl SalvadorEnglandEritreaEthiopiaEuropeFijiFranceGermanyGhanaGreeceGrenadaGuatemalaGuyanaHaitiHondurasHong KongHungaryIndiaIndonesiaIranIraqIrelandIsraelItalyJamaicaJapanJordanKazakhstanKenyaKoreaKuwaitLaosLatin AmericaLatviaLebanonLiberiaLithuaniaMalaysiaMexicoMicronesiaMiddle AfricaMoldovaMoroccoNepalNetherlandsNicaraguaNigeriaNorth AmericaNorth MacedoniaNorthern AfricaNorthern EuropeNorwayOceaniaPakistanPanamaPeruPhilippinesPolandPortugalRomaniaRussiaSaudi ArabiaScotlandSenegalSerbiaSierra LeoneSingaporeSomaliaSouth AfricaSouth AmericaSouth Central AsiaSouth Eastern AsiaSouthern EuropeSpainSri LankaSt. Vincent and the GrenadinesSudanSwedenSwitzerlandSyriaTaiwanThailandTrinidad and TobagoTurkeyUgandaUkraineUruguayUzbekistanVenezuelaVietnamWest IndiesWestern AfricaWestern AsiaWestern EuropeYemenZaireZimbabweAzores
Immigrants from Eastern Europe
Race
Ancestry
AfghanAfricanAlaska NativeAlaskan AthabascanAlbanianAleutAlsatianAmericanApacheArabArapahoArgentineanArmenianAssyrian/Chaldean/SyriacAustralianAustrianBahamianBangladeshiBarbadianBasqueBelgianBelizeanBermudanBhutaneseBlackfeetBolivianBrazilianBritishBritish West IndianBulgarianBurmeseCajunCambodianCanadianCape VerdeanCarpatho RusynCelticCentral AmericanCentral American IndianCherokeeCheyenneChickasawChileanChineseChippewaChoctawColombianColvilleComancheCosta RicanCreeCreekCroatianCrowCubanCypriotCzechCzechoslovakianDanishDelawareDominicanDutchDutch West IndianEastern EuropeanEcuadorianEgyptianEnglishEstonianEthiopianEuropeanFijianFilipinoFinnishFrenchFrench American IndianFrench CanadianGermanGerman RussianGhanaianGreekGuamanian/ChamorroGuatemalanGuyaneseHaitianHmongHonduranHopiHoumaHungarianIcelanderIndian (Asian)IndonesianInupiatIranianIraqiIrishIroquoisIsraeliItalianJamaicanJapaneseJordanianKenyanKiowaKoreanLaotianLatvianLebaneseLiberianLithuanianLumbeeLuxembourgerMacedonianMalaysianMalteseMarshalleseMenomineeMexicanMexican American IndianMongolianMoroccanNative HawaiianNavajoNepaleseNew ZealanderNicaraguanNigerianNorthern EuropeanNorwegianOkinawanOsageOttawaPaiutePakistaniPalestinianPanamanianParaguayanPennsylvania GermanPeruvianPimaPolishPortuguesePotawatomiPuebloPuerto RicanPuget Sound SalishRomanianRussianSalvadoranSamoanScandinavianScotch-IrishScottishSeminoleSenegaleseSerbianShoshoneSierra LeoneanSiouxSlavicSlovakSloveneSomaliSouth AfricanSouth AmericanSouth American IndianSoviet UnionSpaniardSpanishSpanish AmericanSpanish American IndianSri LankanSubsaharan AfricanSudaneseSwedishSwissSyrianTaiwaneseThaiTlingit-HaidaTohono O'OdhamTonganTrinidadian and TobagonianTsimshianTurkishU.S. Virgin IslanderUgandanUkrainianUruguayanUteVenezuelanVietnameseWelshWest IndianYakamaYaquiYugoslavianYumanYup'ikZimbabwean
Immigration
NonimmigrantsImmigrantsAfghanistanAfricaAlbaniaArgentinaArmeniaAsiaAustraliaAustriaBahamasBangladeshBarbadosBelarusBelgiumBelizeBoliviaBosnia and HerzegovinaBrazilBulgariaBurma/MyanmarCabo VerdeCambodiaCameroonCanadaCaribbeanCentral AmericaChileChinaColombiaCongoCosta RicaCroatiaCubaCzechoslovakiaDenmarkDominicaDominican RepublicEastern AfricaEastern AsiaEastern EuropeEcuadorEgyptEl SalvadorEnglandEritreaEthiopiaEuropeFijiFranceGermanyGhanaGreeceGrenadaGuatemalaGuyanaHaitiHondurasHong KongHungaryIndiaIndonesiaIranIraqIrelandIsraelItalyJamaicaJapanJordanKazakhstanKenyaKoreaKuwaitLaosLatin AmericaLatviaLebanonLiberiaLithuaniaMalaysiaMexicoMicronesiaMiddle AfricaMoldovaMoroccoNepalNetherlandsNicaraguaNigeriaNorth AmericaNorth MacedoniaNorthern AfricaNorthern EuropeNorwayOceaniaPakistanPanamaPeruPhilippinesPolandPortugalRomaniaRussiaSaudi ArabiaScotlandSenegalSerbiaSierra LeoneSingaporeSomaliaSouth AfricaSouth Central AsiaSouth Eastern AsiaSouthern EuropeSpainSri LankaSt. Vincent and the GrenadinesSudanSwedenSwitzerlandSyriaTaiwanThailandTrinidad and TobagoTurkeyUgandaUkraineUruguayUzbekistanVenezuelaVietnamWest IndiesWestern AfricaWestern AsiaWestern EuropeYemenZaireZimbabweAzores
College, Under 1 year
Income
Poverty
Unemployment
Labor Participation
Family Structure
Vehicle Availability
Education Level
Disability

College, Under 1 year Comparison

Immigrants from South America

Immigrants from Eastern Europe

Tragic
Exceptional
63.8%
COLLEGE, UNDER 1 YEAR
9.1/ 100
METRIC RATING
213th/ 347
METRIC RANK
67.9%
COLLEGE, UNDER 1 YEAR
96.9/ 100
METRIC RATING
101st/ 347
METRIC RANK

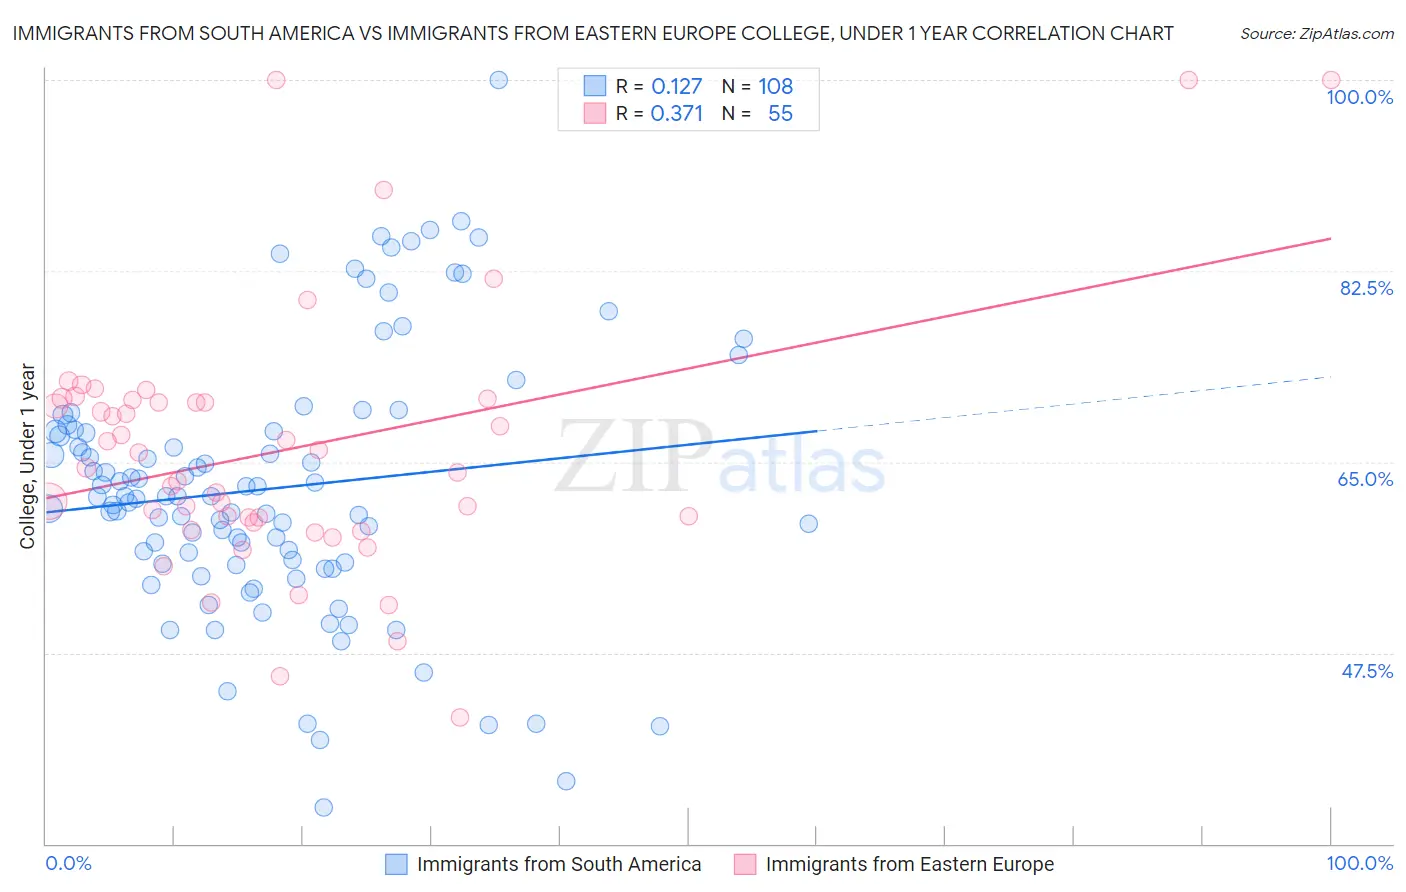
Immigrants from South America vs Immigrants from Eastern Europe College, Under 1 year Correlation Chart

The statistical analysis conducted on geographies consisting of 486,373,097 people shows a poor positive correlation between the proportion of Immigrants from South America and percentage of population with at least college, under 1 year education in the United States with a correlation coefficient (R) of 0.127 and weighted average of 63.8%. Similarly, the statistical analysis conducted on geographies consisting of 475,875,489 people shows a mild positive correlation between the proportion of Immigrants from Eastern Europe and percentage of population with at least college, under 1 year education in the United States with a correlation coefficient (R) of 0.371 and weighted average of 67.9%, a difference of 6.5%.
Immigrants from South America vs Immigrants from Eastern Europe College, Under 1 year

College, Under 1 year Correlation Summary

MeasurementImmigrants from South AmericaImmigrants from Eastern Europe
Minimum33.3%41.6%
Maximum100.0%100.0%
Range66.7%58.4%
Mean62.6%66.0%
Median61.8%64.5%
Interquartile 25% (IQ1)55.7%59.4%
Interquartile 75% (IQ3)67.8%70.7%
Interquartile Range (IQR)12.1%11.3%
Standard Deviation (Sample)12.1%11.8%
Standard Deviation (Population)12.0%11.7%

Similar Demographics by College, Under 1 year

Demographics Similar to Immigrants from South America by College, Under 1 year

In terms of college, under 1 year, the demographic groups most similar to Immigrants from South America are Immigrants from Nigeria (63.7%, a difference of 0.040%), Immigrants from Middle Africa (63.9%, a difference of 0.18%), Native Hawaiian (63.9%, a difference of 0.19%), Senegalese (63.6%, a difference of 0.21%), and Ghanaian (63.9%, a difference of 0.26%).
DemographicsRating | RankCollege, Under 1 year
Whites/Caucasians
12.8
/100
|
#206
Poor
64.0%
Colombians
12.4
/100
|
#207
Poor
64.0%
Immigrants | Vietnam
12.1
/100
|
#208
Poor
64.0%
Puget Sound Salish
11.3
/100
|
#209
Poor
63.9%
Ghanaians
11.2
/100
|
#210
Poor
63.9%
Native Hawaiians
10.6
/100
|
#211
Poor
63.9%
Immigrants | Middle Africa
10.5
/100
|
#212
Poor
63.9%
Immigrants | South America
9.1
/100
|
#213
Tragic
63.8%
Immigrants | Nigeria
8.8
/100
|
#214
Tragic
63.7%
Senegalese
7.7
/100
|
#215
Tragic
63.6%
Hmong
6.8
/100
|
#216
Tragic
63.5%
Immigrants | Uruguay
5.8
/100
|
#217
Tragic
63.4%
Immigrants | Panama
5.7
/100
|
#218
Tragic
63.4%
Immigrants | Fiji
5.7
/100
|
#219
Tragic
63.4%
Portuguese
5.6
/100
|
#220
Tragic
63.4%

Demographics Similar to Immigrants from Eastern Europe by College, Under 1 year

In terms of college, under 1 year, the demographic groups most similar to Immigrants from Eastern Europe are Palestinian (67.9%, a difference of 0.0%), Carpatho Rusyn (67.9%, a difference of 0.010%), Immigrants from Argentina (67.9%, a difference of 0.050%), Immigrants from Bolivia (67.9%, a difference of 0.060%), and Paraguayan (67.9%, a difference of 0.080%).
DemographicsRating | RankCollege, Under 1 year
Armenians
97.7
/100
|
#94
Exceptional
68.1%
Immigrants | Pakistan
97.5
/100
|
#95
Exceptional
68.0%
Jordanians
97.4
/100
|
#96
Exceptional
68.0%
Immigrants | Ethiopia
97.3
/100
|
#97
Exceptional
68.0%
Paraguayans
97.1
/100
|
#98
Exceptional
67.9%
Immigrants | Bolivia
97.0
/100
|
#99
Exceptional
67.9%
Immigrants | Argentina
97.0
/100
|
#100
Exceptional
67.9%
Immigrants | Eastern Europe
96.9
/100
|
#101
Exceptional
67.9%
Palestinians
96.9
/100
|
#102
Exceptional
67.9%
Carpatho Rusyns
96.8
/100
|
#103
Exceptional
67.9%
Immigrants | Western Asia
96.6
/100
|
#104
Exceptional
67.8%
Afghans
96.6
/100
|
#105
Exceptional
67.8%
Immigrants | Croatia
96.6
/100
|
#106
Exceptional
67.8%
Austrians
96.4
/100
|
#107
Exceptional
67.8%
Immigrants | Egypt
96.0
/100
|
#108
Exceptional
67.7%