Immigrants from Singapore vs Immigrants from Jordan Unemployment Among Women with Children Ages 6 to 17 years
COMPARE
Immigrants from Singapore
Immigrants from Jordan
Unemployment Among Women with Children Ages 6 to 17 years
Unemployment Among Women with Children Ages 6 to 17 years Comparison
Immigrants from Singapore
Immigrants from Jordan
7.7%
UNEMPLOYMENT AMONG WOMEN WITH CHILDREN AGES 6 TO 17 YEARS
100.0/ 100
METRIC RATING
20th/ 347
METRIC RANK
9.0%
UNEMPLOYMENT AMONG WOMEN WITH CHILDREN AGES 6 TO 17 YEARS
41.6/ 100
METRIC RATING
177th/ 347
METRIC RANK
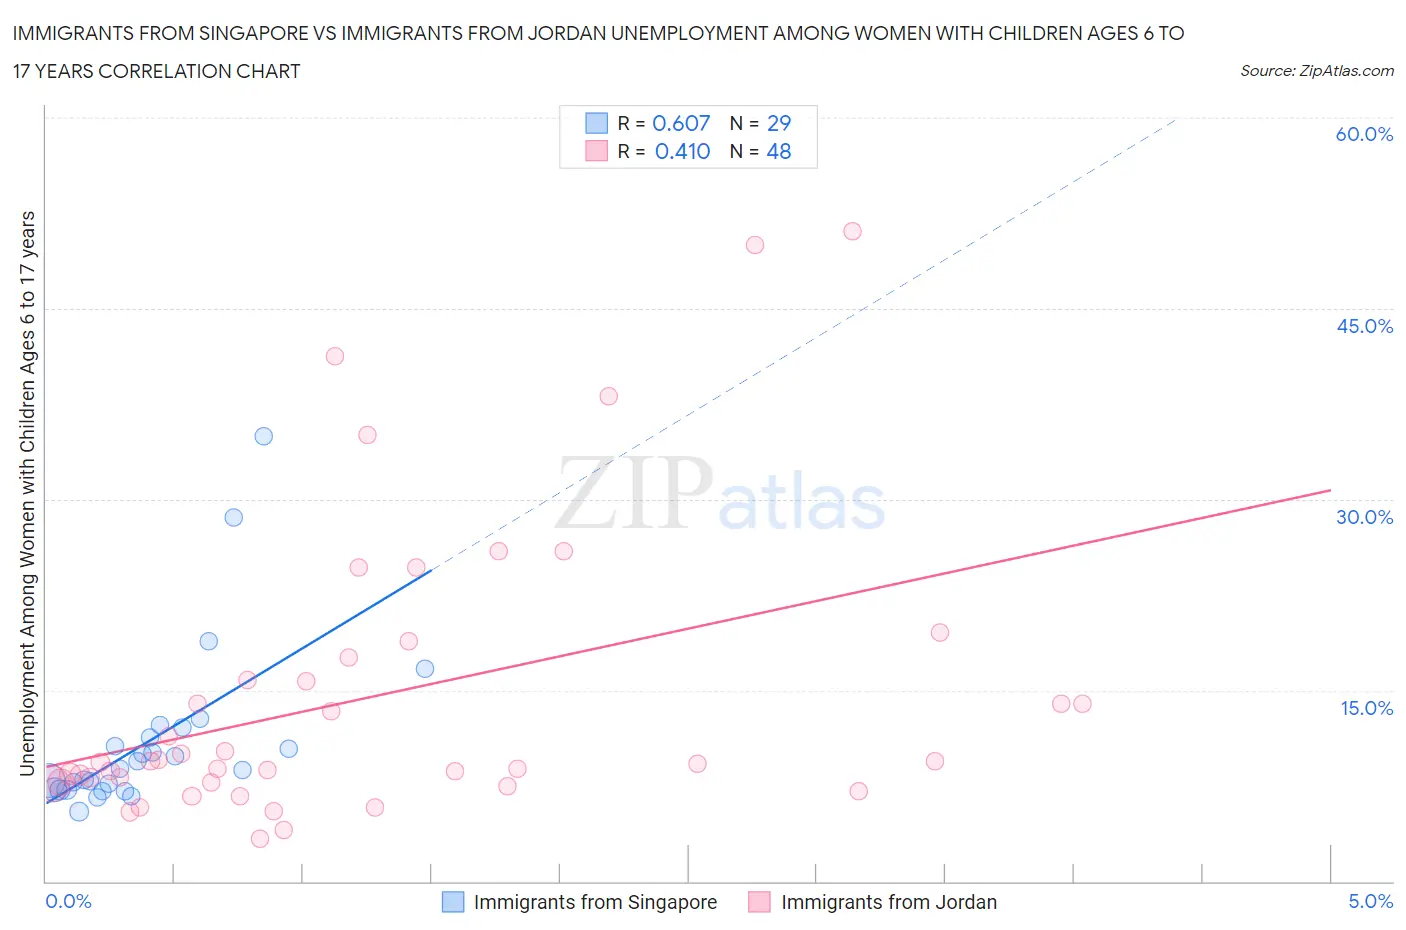
Immigrants from Singapore vs Immigrants from Jordan Unemployment Among Women with Children Ages 6 to 17 years Correlation Chart
The statistical analysis conducted on geographies consisting of 115,099,593 people shows a significant positive correlation between the proportion of Immigrants from Singapore and unemployment rate among women with children between the ages 6 and 17 in the United States with a correlation coefficient (R) of 0.607 and weighted average of 7.7%. Similarly, the statistical analysis conducted on geographies consisting of 151,537,530 people shows a moderate positive correlation between the proportion of Immigrants from Jordan and unemployment rate among women with children between the ages 6 and 17 in the United States with a correlation coefficient (R) of 0.410 and weighted average of 9.0%, a difference of 17.6%.
Unemployment Among Women with Children Ages 6 to 17 years Correlation Summary
| Measurement | Immigrants from Singapore | Immigrants from Jordan |
| Minimum | 5.5% | 3.3% |
| Maximum | 35.0% | 51.1% |
| Range | 29.5% | 47.8% |
| Mean | 11.0% | 14.5% |
| Median | 8.9% | 9.4% |
| Interquartile 25% (IQ1) | 7.2% | 7.8% |
| Interquartile 75% (IQ3) | 11.7% | 16.7% |
| Interquartile Range (IQR) | 4.5% | 9.0% |
| Standard Deviation (Sample) | 6.5% | 11.5% |
| Standard Deviation (Population) | 6.4% | 11.4% |
Similar Demographics by Unemployment Among Women with Children Ages 6 to 17 years
Demographics Similar to Immigrants from Singapore by Unemployment Among Women with Children Ages 6 to 17 years
In terms of unemployment among women with children ages 6 to 17 years, the demographic groups most similar to Immigrants from Singapore are Immigrants from India (7.7%, a difference of 0.13%), Immigrants from China (7.7%, a difference of 0.42%), Immigrants from Indonesia (7.7%, a difference of 0.81%), Nepalese (7.7%, a difference of 0.81%), and Immigrants from Eastern Asia (7.7%, a difference of 0.94%).
| Demographics | Rating | Rank | Unemployment Among Women with Children Ages 6 to 17 years |
| Indonesians | 100.0 /100 | #13 | Exceptional 7.4% |
| Sudanese | 100.0 /100 | #14 | Exceptional 7.4% |
| Puget Sound Salish | 100.0 /100 | #15 | Exceptional 7.5% |
| Immigrants | Burma/Myanmar | 100.0 /100 | #16 | Exceptional 7.5% |
| Cambodians | 100.0 /100 | #17 | Exceptional 7.5% |
| Afghans | 100.0 /100 | #18 | Exceptional 7.6% |
| Filipinos | 100.0 /100 | #19 | Exceptional 7.6% |
| Immigrants | Singapore | 100.0 /100 | #20 | Exceptional 7.7% |
| Immigrants | India | 100.0 /100 | #21 | Exceptional 7.7% |
| Immigrants | China | 100.0 /100 | #22 | Exceptional 7.7% |
| Immigrants | Indonesia | 100.0 /100 | #23 | Exceptional 7.7% |
| Nepalese | 100.0 /100 | #24 | Exceptional 7.7% |
| Immigrants | Eastern Asia | 100.0 /100 | #25 | Exceptional 7.7% |
| Indians (Asian) | 100.0 /100 | #26 | Exceptional 7.7% |
| Immigrants | Afghanistan | 100.0 /100 | #27 | Exceptional 7.8% |
Demographics Similar to Immigrants from Jordan by Unemployment Among Women with Children Ages 6 to 17 years
In terms of unemployment among women with children ages 6 to 17 years, the demographic groups most similar to Immigrants from Jordan are Immigrants from Italy (9.0%, a difference of 0.10%), Menominee (9.0%, a difference of 0.11%), Immigrants from Zaire (9.0%, a difference of 0.15%), Ethiopian (9.0%, a difference of 0.18%), and Immigrants from Sierra Leone (9.0%, a difference of 0.20%).
| Demographics | Rating | Rank | Unemployment Among Women with Children Ages 6 to 17 years |
| Turks | 54.1 /100 | #170 | Average 8.9% |
| Jordanians | 52.2 /100 | #171 | Average 9.0% |
| Immigrants | West Indies | 52.2 /100 | #172 | Average 9.0% |
| Immigrants | Brazil | 51.0 /100 | #173 | Average 9.0% |
| Immigrants | Costa Rica | 50.0 /100 | #174 | Average 9.0% |
| Immigrants | Sierra Leone | 45.9 /100 | #175 | Average 9.0% |
| Immigrants | Italy | 43.7 /100 | #176 | Average 9.0% |
| Immigrants | Jordan | 41.6 /100 | #177 | Average 9.0% |
| Menominee | 39.3 /100 | #178 | Fair 9.0% |
| Immigrants | Zaire | 38.3 /100 | #179 | Fair 9.0% |
| Ethiopians | 37.6 /100 | #180 | Fair 9.0% |
| Immigrants | Czechoslovakia | 34.5 /100 | #181 | Fair 9.0% |
| South American Indians | 34.4 /100 | #182 | Fair 9.0% |
| Swiss | 33.5 /100 | #183 | Fair 9.0% |
| Palestinians | 33.4 /100 | #184 | Fair 9.0% |