Immigrants from Singapore vs Tohono O'odham Unemployment Among Women with Children Ages 6 to 17 years
COMPARE
Immigrants from Singapore
Tohono O'odham
Unemployment Among Women with Children Ages 6 to 17 years
Unemployment Among Women with Children Ages 6 to 17 years Comparison
Immigrants from Singapore
Tohono O'odham
7.7%
UNEMPLOYMENT AMONG WOMEN WITH CHILDREN AGES 6 TO 17 YEARS
100.0/ 100
METRIC RATING
20th/ 347
METRIC RANK
10.7%
UNEMPLOYMENT AMONG WOMEN WITH CHILDREN AGES 6 TO 17 YEARS
0.0/ 100
METRIC RATING
321st/ 347
METRIC RANK
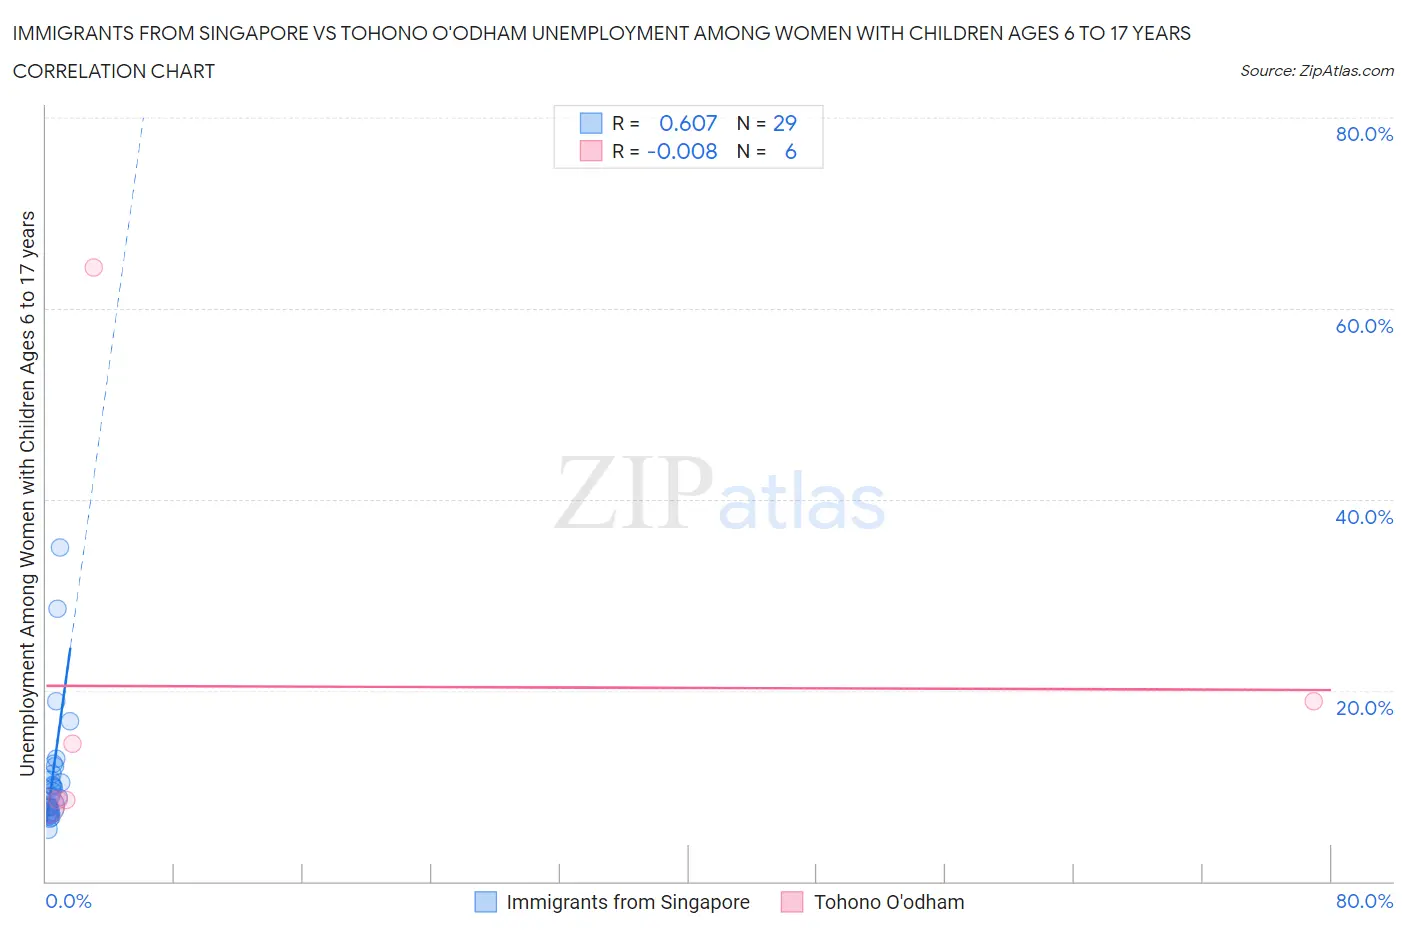
Immigrants from Singapore vs Tohono O'odham Unemployment Among Women with Children Ages 6 to 17 years Correlation Chart
The statistical analysis conducted on geographies consisting of 115,099,593 people shows a significant positive correlation between the proportion of Immigrants from Singapore and unemployment rate among women with children between the ages 6 and 17 in the United States with a correlation coefficient (R) of 0.607 and weighted average of 7.7%. Similarly, the statistical analysis conducted on geographies consisting of 54,737,899 people shows no correlation between the proportion of Tohono O'odham and unemployment rate among women with children between the ages 6 and 17 in the United States with a correlation coefficient (R) of -0.008 and weighted average of 10.7%, a difference of 39.5%.
Unemployment Among Women with Children Ages 6 to 17 years Correlation Summary
| Measurement | Immigrants from Singapore | Tohono O'odham |
| Minimum | 5.5% | 7.8% |
| Maximum | 35.0% | 64.3% |
| Range | 29.5% | 56.5% |
| Mean | 11.0% | 20.4% |
| Median | 8.9% | 11.5% |
| Interquartile 25% (IQ1) | 7.2% | 8.5% |
| Interquartile 75% (IQ3) | 11.7% | 18.8% |
| Interquartile Range (IQR) | 4.5% | 10.3% |
| Standard Deviation (Sample) | 6.5% | 21.9% |
| Standard Deviation (Population) | 6.4% | 20.0% |
Similar Demographics by Unemployment Among Women with Children Ages 6 to 17 years
Demographics Similar to Immigrants from Singapore by Unemployment Among Women with Children Ages 6 to 17 years
In terms of unemployment among women with children ages 6 to 17 years, the demographic groups most similar to Immigrants from Singapore are Immigrants from India (7.7%, a difference of 0.13%), Immigrants from China (7.7%, a difference of 0.42%), Immigrants from Indonesia (7.7%, a difference of 0.81%), Nepalese (7.7%, a difference of 0.81%), and Immigrants from Eastern Asia (7.7%, a difference of 0.94%).
| Demographics | Rating | Rank | Unemployment Among Women with Children Ages 6 to 17 years |
| Indonesians | 100.0 /100 | #13 | Exceptional 7.4% |
| Sudanese | 100.0 /100 | #14 | Exceptional 7.4% |
| Puget Sound Salish | 100.0 /100 | #15 | Exceptional 7.5% |
| Immigrants | Burma/Myanmar | 100.0 /100 | #16 | Exceptional 7.5% |
| Cambodians | 100.0 /100 | #17 | Exceptional 7.5% |
| Afghans | 100.0 /100 | #18 | Exceptional 7.6% |
| Filipinos | 100.0 /100 | #19 | Exceptional 7.6% |
| Immigrants | Singapore | 100.0 /100 | #20 | Exceptional 7.7% |
| Immigrants | India | 100.0 /100 | #21 | Exceptional 7.7% |
| Immigrants | China | 100.0 /100 | #22 | Exceptional 7.7% |
| Immigrants | Indonesia | 100.0 /100 | #23 | Exceptional 7.7% |
| Nepalese | 100.0 /100 | #24 | Exceptional 7.7% |
| Immigrants | Eastern Asia | 100.0 /100 | #25 | Exceptional 7.7% |
| Indians (Asian) | 100.0 /100 | #26 | Exceptional 7.7% |
| Immigrants | Afghanistan | 100.0 /100 | #27 | Exceptional 7.8% |
Demographics Similar to Tohono O'odham by Unemployment Among Women with Children Ages 6 to 17 years
In terms of unemployment among women with children ages 6 to 17 years, the demographic groups most similar to Tohono O'odham are Apache (10.7%, a difference of 0.17%), Immigrants from Uganda (10.7%, a difference of 0.19%), Cree (10.8%, a difference of 1.3%), Dominican (10.8%, a difference of 1.3%), and Immigrants from Dominican Republic (10.8%, a difference of 1.4%).
| Demographics | Rating | Rank | Unemployment Among Women with Children Ages 6 to 17 years |
| Immigrants | Cabo Verde | 0.0 /100 | #314 | Tragic 10.4% |
| Bahamians | 0.0 /100 | #315 | Tragic 10.4% |
| Immigrants | Dominica | 0.0 /100 | #316 | Tragic 10.5% |
| Bermudans | 0.0 /100 | #317 | Tragic 10.5% |
| Delaware | 0.0 /100 | #318 | Tragic 10.5% |
| Immigrants | Uganda | 0.0 /100 | #319 | Tragic 10.7% |
| Apache | 0.0 /100 | #320 | Tragic 10.7% |
| Tohono O'odham | 0.0 /100 | #321 | Tragic 10.7% |
| Cree | 0.0 /100 | #322 | Tragic 10.8% |
| Dominicans | 0.0 /100 | #323 | Tragic 10.8% |
| Immigrants | Dominican Republic | 0.0 /100 | #324 | Tragic 10.8% |
| Cajuns | 0.0 /100 | #325 | Tragic 10.8% |
| Liberians | 0.0 /100 | #326 | Tragic 10.8% |
| Cape Verdeans | 0.0 /100 | #327 | Tragic 10.9% |
| Ottawa | 0.0 /100 | #328 | Tragic 10.9% |