Immigrants from Singapore vs Blackfeet Unemployment Among Women with Children Ages 6 to 17 years
COMPARE
Immigrants from Singapore
Blackfeet
Unemployment Among Women with Children Ages 6 to 17 years
Unemployment Among Women with Children Ages 6 to 17 years Comparison
Immigrants from Singapore
Blackfeet
7.7%
UNEMPLOYMENT AMONG WOMEN WITH CHILDREN AGES 6 TO 17 YEARS
100.0/ 100
METRIC RATING
20th/ 347
METRIC RANK
9.6%
UNEMPLOYMENT AMONG WOMEN WITH CHILDREN AGES 6 TO 17 YEARS
0.2/ 100
METRIC RATING
269th/ 347
METRIC RANK
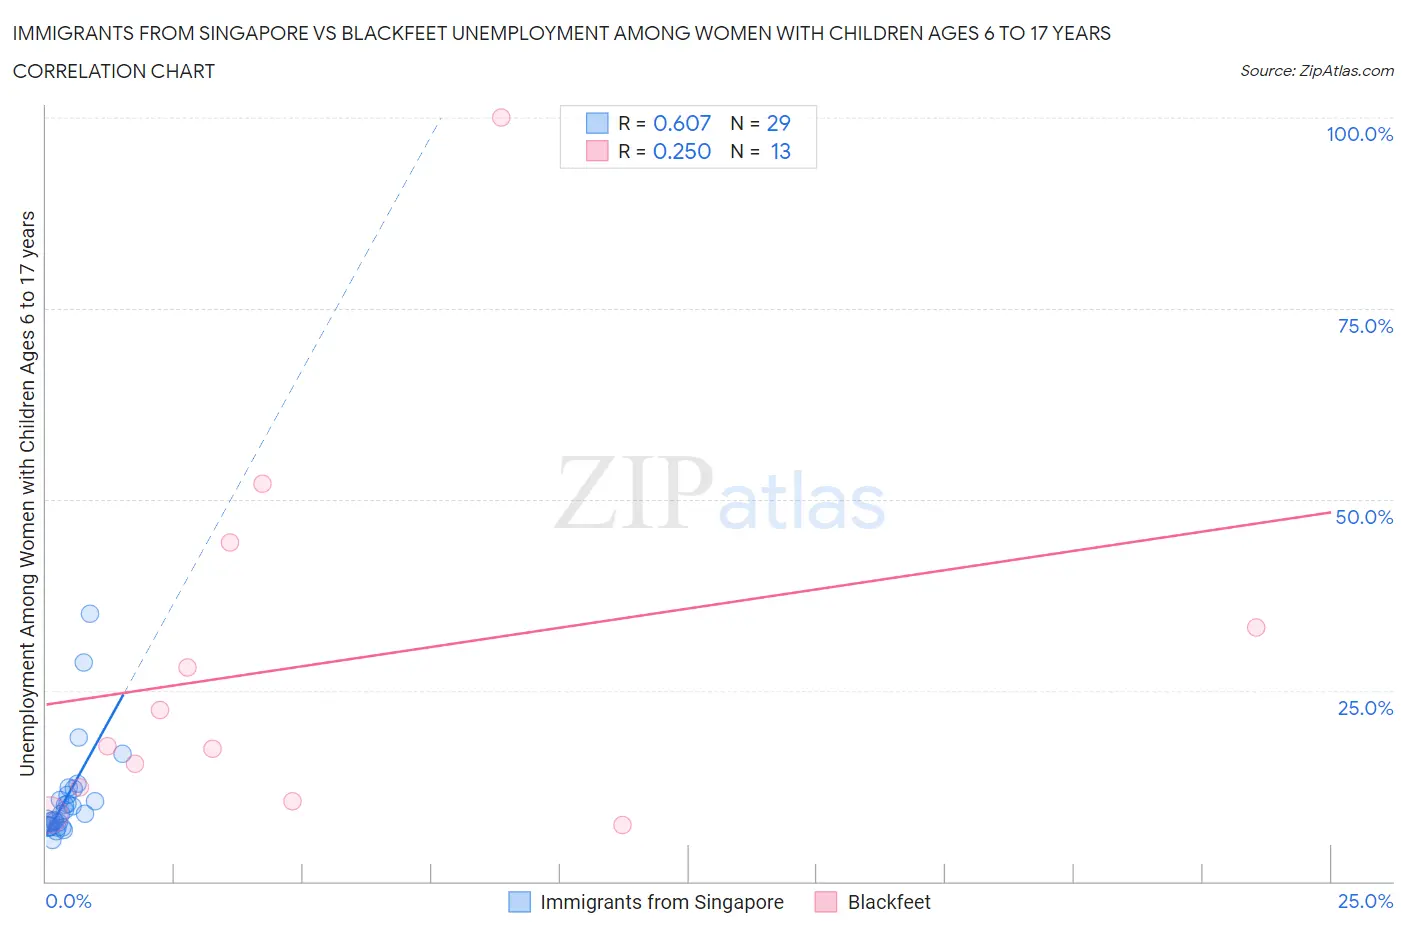
Immigrants from Singapore vs Blackfeet Unemployment Among Women with Children Ages 6 to 17 years Correlation Chart
The statistical analysis conducted on geographies consisting of 115,099,593 people shows a significant positive correlation between the proportion of Immigrants from Singapore and unemployment rate among women with children between the ages 6 and 17 in the United States with a correlation coefficient (R) of 0.607 and weighted average of 7.7%. Similarly, the statistical analysis conducted on geographies consisting of 237,122,541 people shows a weak positive correlation between the proportion of Blackfeet and unemployment rate among women with children between the ages 6 and 17 in the United States with a correlation coefficient (R) of 0.250 and weighted average of 9.6%, a difference of 25.2%.
Unemployment Among Women with Children Ages 6 to 17 years Correlation Summary
| Measurement | Immigrants from Singapore | Blackfeet |
| Minimum | 5.5% | 7.4% |
| Maximum | 35.0% | 100.0% |
| Range | 29.5% | 92.6% |
| Mean | 11.0% | 28.4% |
| Median | 8.9% | 17.6% |
| Interquartile 25% (IQ1) | 7.2% | 11.4% |
| Interquartile 75% (IQ3) | 11.7% | 38.8% |
| Interquartile Range (IQR) | 4.5% | 27.5% |
| Standard Deviation (Sample) | 6.5% | 25.5% |
| Standard Deviation (Population) | 6.4% | 24.5% |
Similar Demographics by Unemployment Among Women with Children Ages 6 to 17 years
Demographics Similar to Immigrants from Singapore by Unemployment Among Women with Children Ages 6 to 17 years
In terms of unemployment among women with children ages 6 to 17 years, the demographic groups most similar to Immigrants from Singapore are Immigrants from India (7.7%, a difference of 0.13%), Immigrants from China (7.7%, a difference of 0.42%), Immigrants from Indonesia (7.7%, a difference of 0.81%), Nepalese (7.7%, a difference of 0.81%), and Immigrants from Eastern Asia (7.7%, a difference of 0.94%).
| Demographics | Rating | Rank | Unemployment Among Women with Children Ages 6 to 17 years |
| Indonesians | 100.0 /100 | #13 | Exceptional 7.4% |
| Sudanese | 100.0 /100 | #14 | Exceptional 7.4% |
| Puget Sound Salish | 100.0 /100 | #15 | Exceptional 7.5% |
| Immigrants | Burma/Myanmar | 100.0 /100 | #16 | Exceptional 7.5% |
| Cambodians | 100.0 /100 | #17 | Exceptional 7.5% |
| Afghans | 100.0 /100 | #18 | Exceptional 7.6% |
| Filipinos | 100.0 /100 | #19 | Exceptional 7.6% |
| Immigrants | Singapore | 100.0 /100 | #20 | Exceptional 7.7% |
| Immigrants | India | 100.0 /100 | #21 | Exceptional 7.7% |
| Immigrants | China | 100.0 /100 | #22 | Exceptional 7.7% |
| Immigrants | Indonesia | 100.0 /100 | #23 | Exceptional 7.7% |
| Nepalese | 100.0 /100 | #24 | Exceptional 7.7% |
| Immigrants | Eastern Asia | 100.0 /100 | #25 | Exceptional 7.7% |
| Indians (Asian) | 100.0 /100 | #26 | Exceptional 7.7% |
| Immigrants | Afghanistan | 100.0 /100 | #27 | Exceptional 7.8% |
Demographics Similar to Blackfeet by Unemployment Among Women with Children Ages 6 to 17 years
In terms of unemployment among women with children ages 6 to 17 years, the demographic groups most similar to Blackfeet are Ghanaian (9.6%, a difference of 0.080%), Immigrants from Nicaragua (9.6%, a difference of 0.10%), Irish (9.5%, a difference of 0.47%), Immigrants from Jamaica (9.5%, a difference of 0.49%), and Immigrants from Latin America (9.6%, a difference of 0.50%).
| Demographics | Rating | Rank | Unemployment Among Women with Children Ages 6 to 17 years |
| Senegalese | 0.5 /100 | #262 | Tragic 9.5% |
| Lebanese | 0.5 /100 | #263 | Tragic 9.5% |
| Immigrants | Ghana | 0.4 /100 | #264 | Tragic 9.5% |
| West Indians | 0.4 /100 | #265 | Tragic 9.5% |
| Immigrants | Jamaica | 0.3 /100 | #266 | Tragic 9.5% |
| Irish | 0.3 /100 | #267 | Tragic 9.5% |
| Ghanaians | 0.2 /100 | #268 | Tragic 9.6% |
| Blackfeet | 0.2 /100 | #269 | Tragic 9.6% |
| Immigrants | Nicaragua | 0.2 /100 | #270 | Tragic 9.6% |
| Immigrants | Latin America | 0.1 /100 | #271 | Tragic 9.6% |
| Kiowa | 0.1 /100 | #272 | Tragic 9.6% |
| Whites/Caucasians | 0.1 /100 | #273 | Tragic 9.6% |
| Aleuts | 0.1 /100 | #274 | Tragic 9.6% |
| U.S. Virgin Islanders | 0.1 /100 | #275 | Tragic 9.7% |
| Immigrants | Portugal | 0.1 /100 | #276 | Tragic 9.7% |