Dominican vs Immigrants from Jordan Unemployment Among Women with Children Ages 6 to 17 years
COMPARE
Dominican
Immigrants from Jordan
Unemployment Among Women with Children Ages 6 to 17 years
Unemployment Among Women with Children Ages 6 to 17 years Comparison
Dominicans
Immigrants from Jordan
10.8%
UNEMPLOYMENT AMONG WOMEN WITH CHILDREN AGES 6 TO 17 YEARS
0.0/ 100
METRIC RATING
323rd/ 347
METRIC RANK
9.0%
UNEMPLOYMENT AMONG WOMEN WITH CHILDREN AGES 6 TO 17 YEARS
41.6/ 100
METRIC RATING
177th/ 347
METRIC RANK
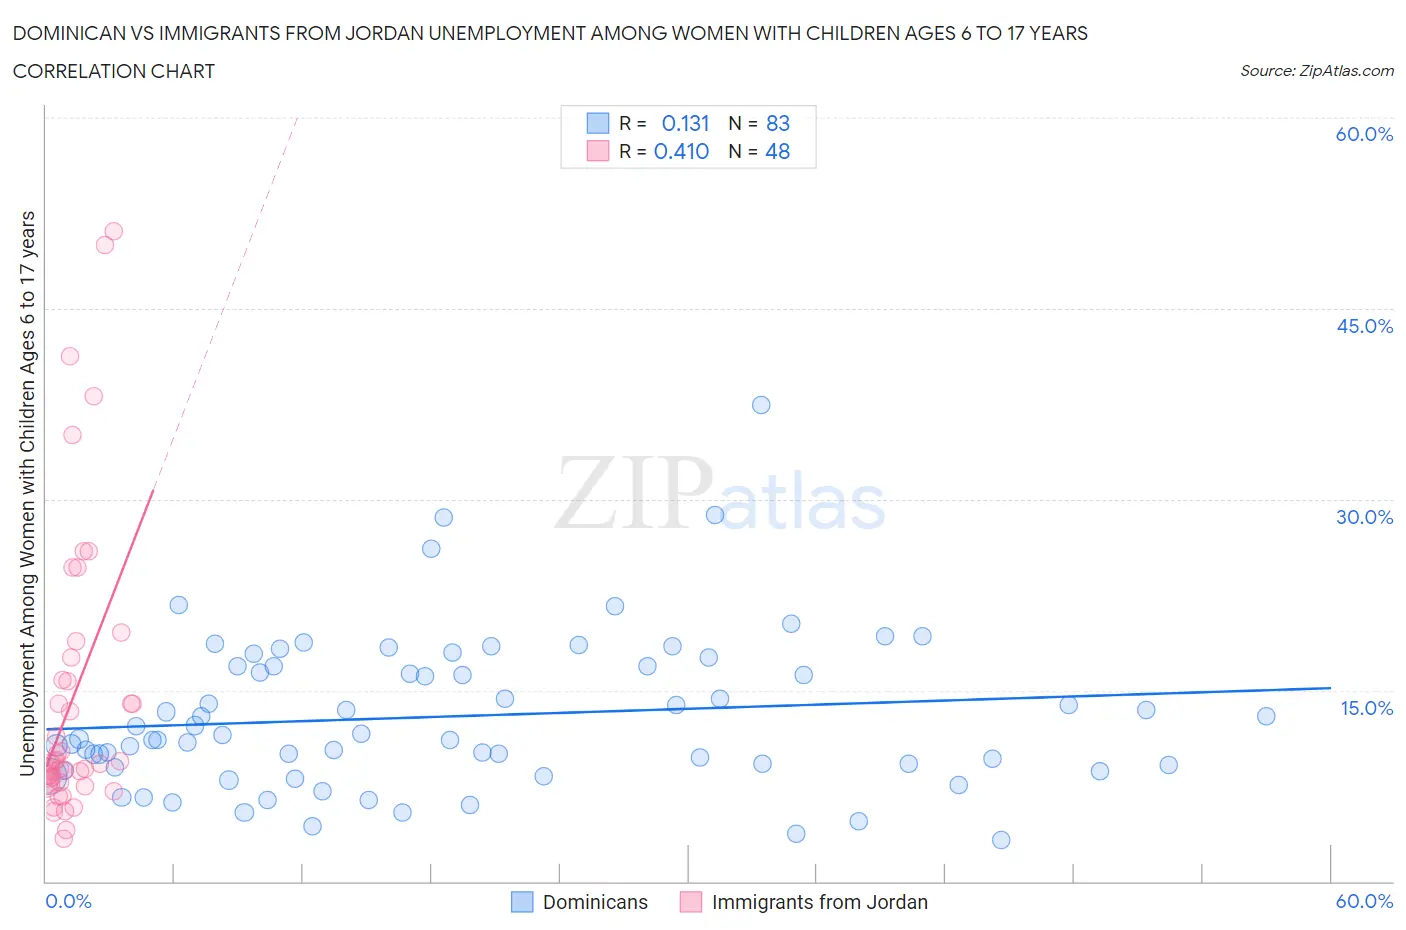
Dominican vs Immigrants from Jordan Unemployment Among Women with Children Ages 6 to 17 years Correlation Chart
The statistical analysis conducted on geographies consisting of 262,781,986 people shows a poor positive correlation between the proportion of Dominicans and unemployment rate among women with children between the ages 6 and 17 in the United States with a correlation coefficient (R) of 0.131 and weighted average of 10.8%. Similarly, the statistical analysis conducted on geographies consisting of 151,537,530 people shows a moderate positive correlation between the proportion of Immigrants from Jordan and unemployment rate among women with children between the ages 6 and 17 in the United States with a correlation coefficient (R) of 0.410 and weighted average of 9.0%, a difference of 20.2%.
Unemployment Among Women with Children Ages 6 to 17 years Correlation Summary
| Measurement | Dominican | Immigrants from Jordan |
| Minimum | 3.2% | 3.3% |
| Maximum | 37.4% | 51.1% |
| Range | 34.2% | 47.8% |
| Mean | 13.0% | 14.5% |
| Median | 11.2% | 9.4% |
| Interquartile 25% (IQ1) | 9.0% | 7.8% |
| Interquartile 75% (IQ3) | 16.9% | 16.7% |
| Interquartile Range (IQR) | 7.9% | 9.0% |
| Standard Deviation (Sample) | 6.1% | 11.5% |
| Standard Deviation (Population) | 6.0% | 11.4% |
Similar Demographics by Unemployment Among Women with Children Ages 6 to 17 years
Demographics Similar to Dominicans by Unemployment Among Women with Children Ages 6 to 17 years
In terms of unemployment among women with children ages 6 to 17 years, the demographic groups most similar to Dominicans are Cree (10.8%, a difference of 0.050%), Immigrants from Dominican Republic (10.8%, a difference of 0.060%), Cajun (10.8%, a difference of 0.24%), Liberian (10.8%, a difference of 0.31%), and Cape Verdean (10.9%, a difference of 0.38%).
| Demographics | Rating | Rank | Unemployment Among Women with Children Ages 6 to 17 years |
| Immigrants | Dominica | 0.0 /100 | #316 | Tragic 10.5% |
| Bermudans | 0.0 /100 | #317 | Tragic 10.5% |
| Delaware | 0.0 /100 | #318 | Tragic 10.5% |
| Immigrants | Uganda | 0.0 /100 | #319 | Tragic 10.7% |
| Apache | 0.0 /100 | #320 | Tragic 10.7% |
| Tohono O'odham | 0.0 /100 | #321 | Tragic 10.7% |
| Cree | 0.0 /100 | #322 | Tragic 10.8% |
| Dominicans | 0.0 /100 | #323 | Tragic 10.8% |
| Immigrants | Dominican Republic | 0.0 /100 | #324 | Tragic 10.8% |
| Cajuns | 0.0 /100 | #325 | Tragic 10.8% |
| Liberians | 0.0 /100 | #326 | Tragic 10.8% |
| Cape Verdeans | 0.0 /100 | #327 | Tragic 10.9% |
| Ottawa | 0.0 /100 | #328 | Tragic 10.9% |
| Pennsylvania Germans | 0.0 /100 | #329 | Tragic 11.0% |
| Chippewa | 0.0 /100 | #330 | Tragic 11.1% |
Demographics Similar to Immigrants from Jordan by Unemployment Among Women with Children Ages 6 to 17 years
In terms of unemployment among women with children ages 6 to 17 years, the demographic groups most similar to Immigrants from Jordan are Immigrants from Italy (9.0%, a difference of 0.10%), Menominee (9.0%, a difference of 0.11%), Immigrants from Zaire (9.0%, a difference of 0.15%), Ethiopian (9.0%, a difference of 0.18%), and Immigrants from Sierra Leone (9.0%, a difference of 0.20%).
| Demographics | Rating | Rank | Unemployment Among Women with Children Ages 6 to 17 years |
| Turks | 54.1 /100 | #170 | Average 8.9% |
| Jordanians | 52.2 /100 | #171 | Average 9.0% |
| Immigrants | West Indies | 52.2 /100 | #172 | Average 9.0% |
| Immigrants | Brazil | 51.0 /100 | #173 | Average 9.0% |
| Immigrants | Costa Rica | 50.0 /100 | #174 | Average 9.0% |
| Immigrants | Sierra Leone | 45.9 /100 | #175 | Average 9.0% |
| Immigrants | Italy | 43.7 /100 | #176 | Average 9.0% |
| Immigrants | Jordan | 41.6 /100 | #177 | Average 9.0% |
| Menominee | 39.3 /100 | #178 | Fair 9.0% |
| Immigrants | Zaire | 38.3 /100 | #179 | Fair 9.0% |
| Ethiopians | 37.6 /100 | #180 | Fair 9.0% |
| Immigrants | Czechoslovakia | 34.5 /100 | #181 | Fair 9.0% |
| South American Indians | 34.4 /100 | #182 | Fair 9.0% |
| Swiss | 33.5 /100 | #183 | Fair 9.0% |
| Palestinians | 33.4 /100 | #184 | Fair 9.0% |