Immigrants from Canada vs Immigrants from Kenya Unemployment
COMPARE
Immigrants from Canada
Immigrants from Kenya
Unemployment
Unemployment Comparison
Immigrants from Canada
Immigrants from Kenya
4.9%
UNEMPLOYMENT
98.8/ 100
METRIC RATING
65th/ 347
METRIC RANK
5.1%
UNEMPLOYMENT
88.2/ 100
METRIC RATING
127th/ 347
METRIC RANK
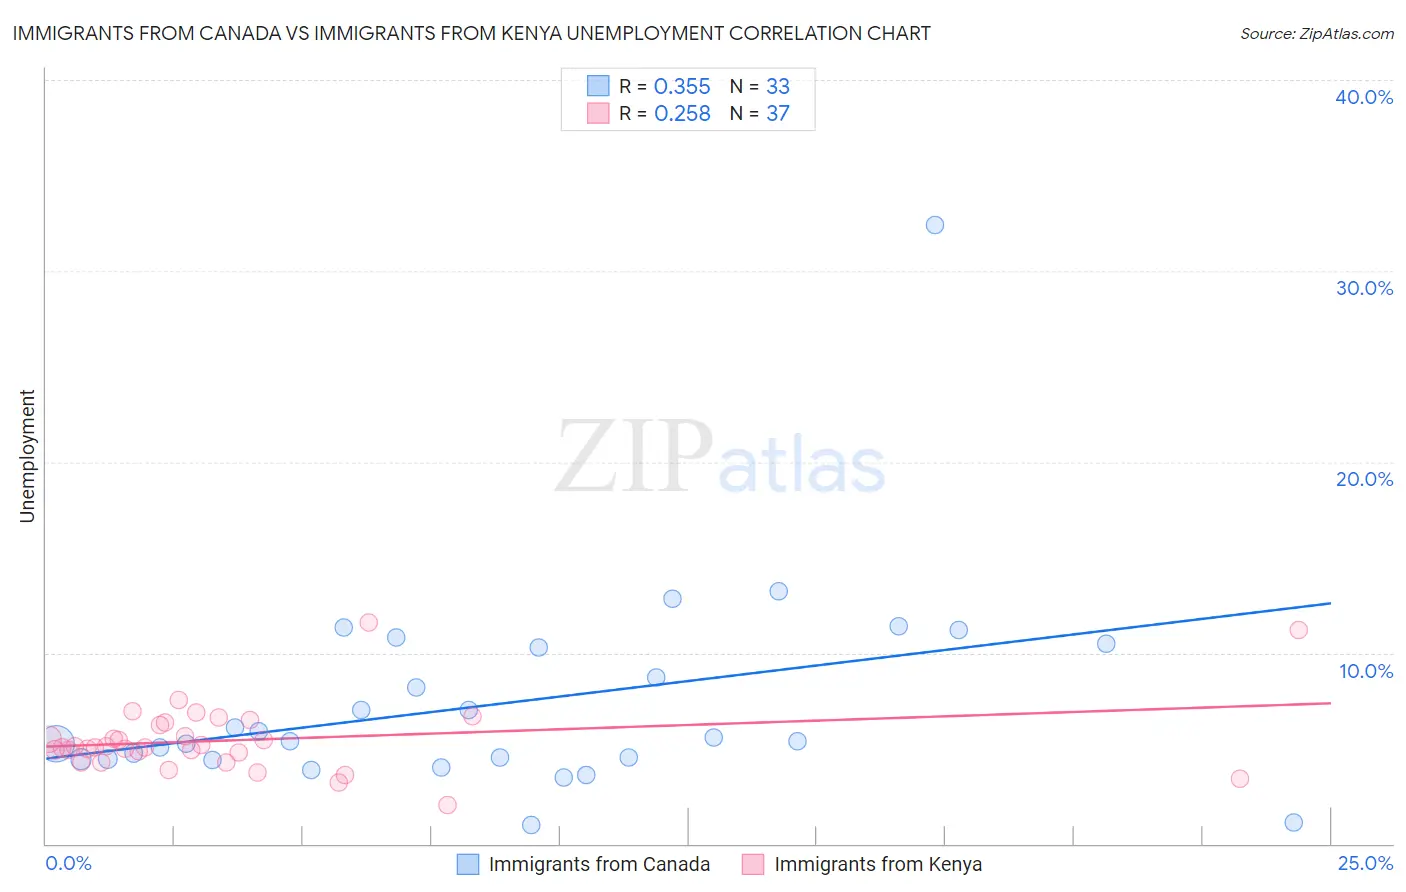
Immigrants from Canada vs Immigrants from Kenya Unemployment Correlation Chart
The statistical analysis conducted on geographies consisting of 458,510,369 people shows a mild positive correlation between the proportion of Immigrants from Canada and unemployment in the United States with a correlation coefficient (R) of 0.355 and weighted average of 4.9%. Similarly, the statistical analysis conducted on geographies consisting of 217,993,568 people shows a weak positive correlation between the proportion of Immigrants from Kenya and unemployment in the United States with a correlation coefficient (R) of 0.258 and weighted average of 5.1%, a difference of 3.9%.
Unemployment Correlation Summary
| Measurement | Immigrants from Canada | Immigrants from Kenya |
| Minimum | 1.0% | 2.0% |
| Maximum | 32.4% | 11.6% |
| Range | 31.4% | 9.6% |
| Mean | 7.4% | 5.4% |
| Median | 5.4% | 5.0% |
| Interquartile 25% (IQ1) | 4.4% | 4.5% |
| Interquartile 75% (IQ3) | 10.4% | 6.3% |
| Interquartile Range (IQR) | 5.9% | 1.7% |
| Standard Deviation (Sample) | 5.5% | 1.8% |
| Standard Deviation (Population) | 5.5% | 1.8% |
Similar Demographics by Unemployment
Demographics Similar to Immigrants from Canada by Unemployment
In terms of unemployment, the demographic groups most similar to Immigrants from Canada are Italian (4.9%, a difference of 0.14%), Slovak (4.9%, a difference of 0.15%), New Zealander (4.9%, a difference of 0.19%), Slavic (4.9%, a difference of 0.22%), and Immigrants from Bulgaria (4.9%, a difference of 0.23%).
| Demographics | Rating | Rank | Unemployment |
| Greeks | 99.0 /100 | #58 | Exceptional 4.9% |
| Bhutanese | 99.0 /100 | #59 | Exceptional 4.9% |
| Immigrants | Netherlands | 99.0 /100 | #60 | Exceptional 4.9% |
| Cambodians | 99.0 /100 | #61 | Exceptional 4.9% |
| Icelanders | 98.9 /100 | #62 | Exceptional 4.9% |
| Immigrants | Bulgaria | 98.9 /100 | #63 | Exceptional 4.9% |
| Italians | 98.9 /100 | #64 | Exceptional 4.9% |
| Immigrants | Canada | 98.8 /100 | #65 | Exceptional 4.9% |
| Slovaks | 98.7 /100 | #66 | Exceptional 4.9% |
| New Zealanders | 98.6 /100 | #67 | Exceptional 4.9% |
| Slavs | 98.6 /100 | #68 | Exceptional 4.9% |
| Immigrants | North America | 98.5 /100 | #69 | Exceptional 4.9% |
| Serbians | 98.4 /100 | #70 | Exceptional 4.9% |
| Immigrants | Japan | 98.3 /100 | #71 | Exceptional 4.9% |
| Burmese | 98.3 /100 | #72 | Exceptional 4.9% |
Demographics Similar to Immigrants from Kenya by Unemployment
In terms of unemployment, the demographic groups most similar to Immigrants from Kenya are Kenyan (5.1%, a difference of 0.0%), Immigrants from Eastern Asia (5.1%, a difference of 0.020%), Immigrants from Eastern Africa (5.1%, a difference of 0.020%), Immigrants from Latvia (5.1%, a difference of 0.020%), and Ethiopian (5.1%, a difference of 0.070%).
| Demographics | Rating | Rank | Unemployment |
| Macedonians | 89.7 /100 | #120 | Excellent 5.1% |
| Lebanese | 89.2 /100 | #121 | Excellent 5.1% |
| Immigrants | Switzerland | 89.1 /100 | #122 | Excellent 5.1% |
| Asians | 89.0 /100 | #123 | Excellent 5.1% |
| Ethiopians | 88.6 /100 | #124 | Excellent 5.1% |
| Immigrants | Eastern Asia | 88.3 /100 | #125 | Excellent 5.1% |
| Kenyans | 88.2 /100 | #126 | Excellent 5.1% |
| Immigrants | Kenya | 88.2 /100 | #127 | Excellent 5.1% |
| Immigrants | Eastern Africa | 88.1 /100 | #128 | Excellent 5.1% |
| Immigrants | Latvia | 88.0 /100 | #129 | Excellent 5.1% |
| Iranians | 86.9 /100 | #130 | Excellent 5.1% |
| Immigrants | Croatia | 86.8 /100 | #131 | Excellent 5.1% |
| Immigrants | Ethiopia | 86.7 /100 | #132 | Excellent 5.1% |
| Immigrants | Jordan | 86.6 /100 | #133 | Excellent 5.1% |
| Immigrants | Europe | 86.3 /100 | #134 | Excellent 5.1% |