Immigrants from Sierra Leone vs Chickasaw Male Unemployment
COMPARE
Immigrants from Sierra Leone
Chickasaw
Male Unemployment
Male Unemployment Comparison
Immigrants from Sierra Leone
Chickasaw
6.0%
MALE UNEMPLOYMENT
0.0/ 100
METRIC RATING
274th/ 347
METRIC RANK
5.2%
MALE UNEMPLOYMENT
82.9/ 100
METRIC RATING
132nd/ 347
METRIC RANK
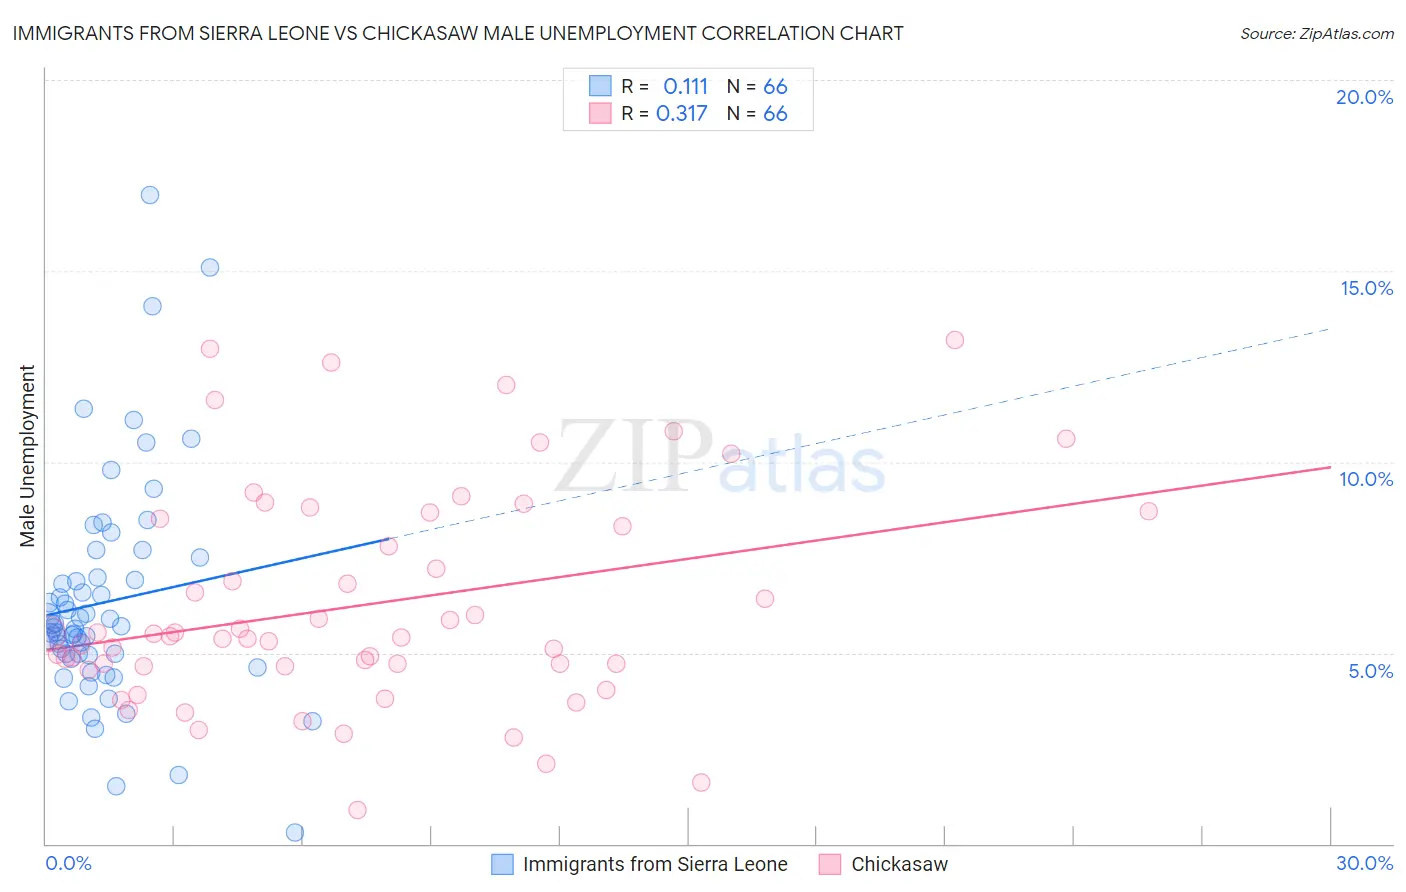
Immigrants from Sierra Leone vs Chickasaw Male Unemployment Correlation Chart
The statistical analysis conducted on geographies consisting of 101,591,939 people shows a poor positive correlation between the proportion of Immigrants from Sierra Leone and unemployment rate among males in the United States with a correlation coefficient (R) of 0.111 and weighted average of 6.0%. Similarly, the statistical analysis conducted on geographies consisting of 147,341,260 people shows a mild positive correlation between the proportion of Chickasaw and unemployment rate among males in the United States with a correlation coefficient (R) of 0.317 and weighted average of 5.2%, a difference of 16.3%.
Male Unemployment Correlation Summary
| Measurement | Immigrants from Sierra Leone | Chickasaw |
| Minimum | 0.30% | 0.90% |
| Maximum | 17.0% | 13.2% |
| Range | 16.7% | 12.3% |
| Mean | 6.3% | 6.3% |
| Median | 5.7% | 5.4% |
| Interquartile 25% (IQ1) | 4.9% | 4.7% |
| Interquartile 75% (IQ3) | 7.0% | 8.5% |
| Interquartile Range (IQR) | 2.0% | 3.8% |
| Standard Deviation (Sample) | 2.9% | 2.8% |
| Standard Deviation (Population) | 2.9% | 2.8% |
Similar Demographics by Male Unemployment
Demographics Similar to Immigrants from Sierra Leone by Male Unemployment
In terms of male unemployment, the demographic groups most similar to Immigrants from Sierra Leone are Menominee (6.0%, a difference of 0.15%), Armenian (6.0%, a difference of 0.17%), Immigrants from Uzbekistan (6.0%, a difference of 0.18%), Tlingit-Haida (6.0%, a difference of 0.25%), and Blackfeet (6.0%, a difference of 0.41%).
| Demographics | Rating | Rank | Male Unemployment |
| Nigerians | 0.0 /100 | #267 | Tragic 5.9% |
| Bermudans | 0.0 /100 | #268 | Tragic 5.9% |
| Immigrants | Nigeria | 0.0 /100 | #269 | Tragic 6.0% |
| Sub-Saharan Africans | 0.0 /100 | #270 | Tragic 6.0% |
| Blackfeet | 0.0 /100 | #271 | Tragic 6.0% |
| Immigrants | Uzbekistan | 0.0 /100 | #272 | Tragic 6.0% |
| Armenians | 0.0 /100 | #273 | Tragic 6.0% |
| Immigrants | Sierra Leone | 0.0 /100 | #274 | Tragic 6.0% |
| Menominee | 0.0 /100 | #275 | Tragic 6.0% |
| Tlingit-Haida | 0.0 /100 | #276 | Tragic 6.0% |
| Immigrants | Liberia | 0.0 /100 | #277 | Tragic 6.1% |
| Immigrants | Fiji | 0.0 /100 | #278 | Tragic 6.1% |
| Ghanaians | 0.0 /100 | #279 | Tragic 6.1% |
| Immigrants | Ghana | 0.0 /100 | #280 | Tragic 6.2% |
| Sierra Leoneans | 0.0 /100 | #281 | Tragic 6.2% |
Demographics Similar to Chickasaw by Male Unemployment
In terms of male unemployment, the demographic groups most similar to Chickasaw are Immigrants from Germany (5.2%, a difference of 0.020%), Immigrants from Malaysia (5.2%, a difference of 0.070%), Colombian (5.2%, a difference of 0.18%), Immigrants from Western Europe (5.2%, a difference of 0.21%), and Pakistani (5.2%, a difference of 0.24%).
| Demographics | Rating | Rank | Male Unemployment |
| Immigrants | Lithuania | 87.2 /100 | #125 | Excellent 5.1% |
| Immigrants | Colombia | 86.8 /100 | #126 | Excellent 5.1% |
| Immigrants | Brazil | 86.3 /100 | #127 | Excellent 5.2% |
| Hungarians | 85.1 /100 | #128 | Excellent 5.2% |
| Immigrants | Western Europe | 84.8 /100 | #129 | Excellent 5.2% |
| Immigrants | Malaysia | 83.5 /100 | #130 | Excellent 5.2% |
| Immigrants | Germany | 83.0 /100 | #131 | Excellent 5.2% |
| Chickasaw | 82.9 /100 | #132 | Excellent 5.2% |
| Colombians | 81.1 /100 | #133 | Excellent 5.2% |
| Pakistanis | 80.5 /100 | #134 | Excellent 5.2% |
| Immigrants | Saudi Arabia | 80.1 /100 | #135 | Excellent 5.2% |
| Lebanese | 79.9 /100 | #136 | Good 5.2% |
| Immigrants | Eastern Africa | 79.8 /100 | #137 | Good 5.2% |
| Immigrants | Croatia | 79.7 /100 | #138 | Good 5.2% |
| Kenyans | 79.4 /100 | #139 | Good 5.2% |