Immigrants from Sierra Leone vs Asian Male Unemployment
COMPARE
Immigrants from Sierra Leone
Asian
Male Unemployment
Male Unemployment Comparison
Immigrants from Sierra Leone
Asians
6.0%
MALE UNEMPLOYMENT
0.0/ 100
METRIC RATING
274th/ 347
METRIC RANK
5.1%
MALE UNEMPLOYMENT
93.7/ 100
METRIC RATING
96th/ 347
METRIC RANK
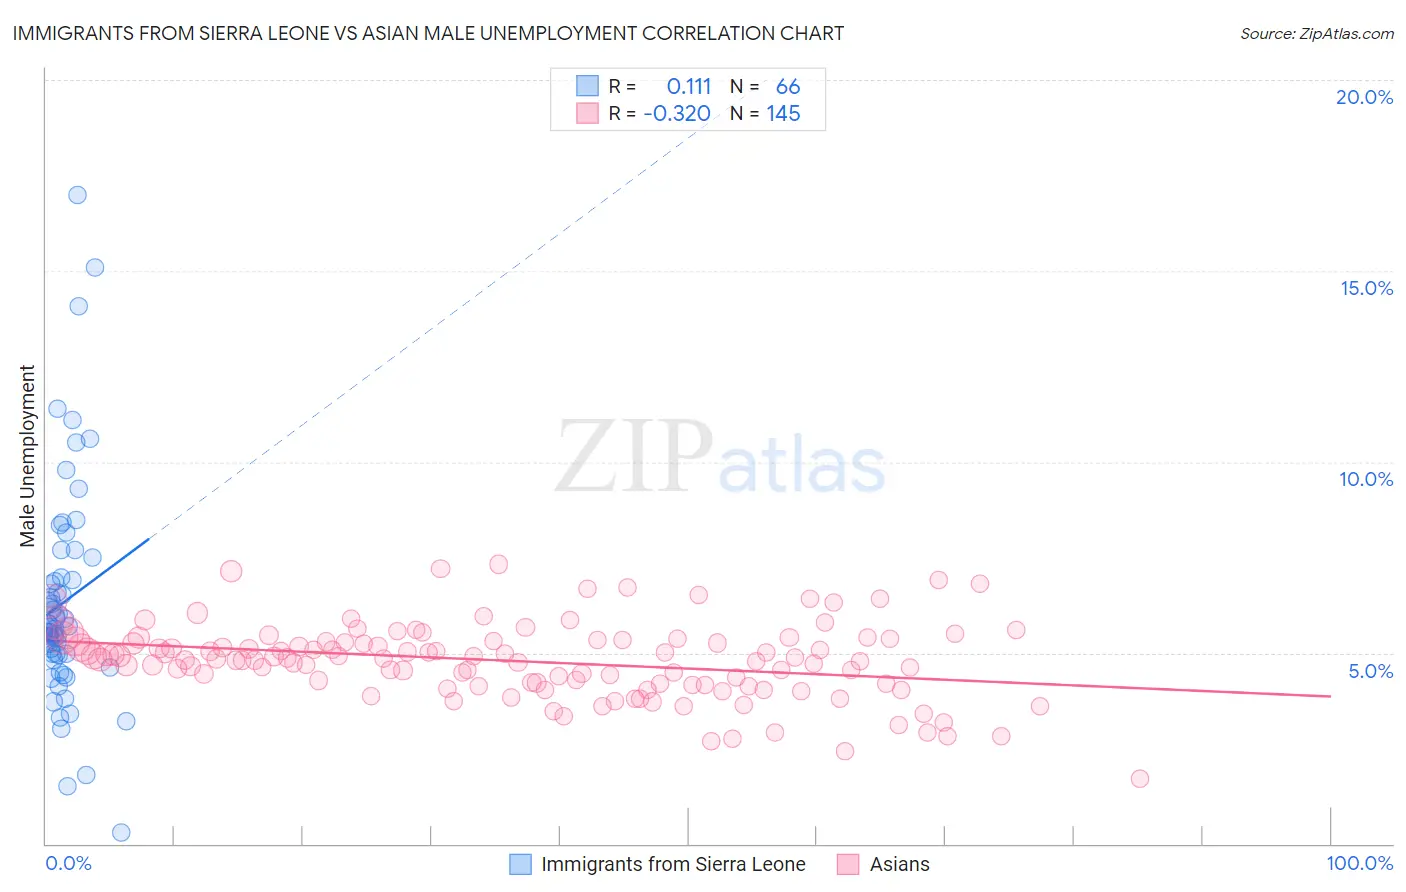
Immigrants from Sierra Leone vs Asian Male Unemployment Correlation Chart
The statistical analysis conducted on geographies consisting of 101,591,939 people shows a poor positive correlation between the proportion of Immigrants from Sierra Leone and unemployment rate among males in the United States with a correlation coefficient (R) of 0.111 and weighted average of 6.0%. Similarly, the statistical analysis conducted on geographies consisting of 543,892,334 people shows a mild negative correlation between the proportion of Asians and unemployment rate among males in the United States with a correlation coefficient (R) of -0.320 and weighted average of 5.1%, a difference of 18.3%.
Male Unemployment Correlation Summary
| Measurement | Immigrants from Sierra Leone | Asian |
| Minimum | 0.30% | 1.7% |
| Maximum | 17.0% | 7.3% |
| Range | 16.7% | 5.6% |
| Mean | 6.3% | 4.8% |
| Median | 5.7% | 4.8% |
| Interquartile 25% (IQ1) | 4.9% | 4.2% |
| Interquartile 75% (IQ3) | 7.0% | 5.3% |
| Interquartile Range (IQR) | 2.0% | 1.1% |
| Standard Deviation (Sample) | 2.9% | 0.98% |
| Standard Deviation (Population) | 2.9% | 0.98% |
Similar Demographics by Male Unemployment
Demographics Similar to Immigrants from Sierra Leone by Male Unemployment
In terms of male unemployment, the demographic groups most similar to Immigrants from Sierra Leone are Menominee (6.0%, a difference of 0.15%), Armenian (6.0%, a difference of 0.17%), Immigrants from Uzbekistan (6.0%, a difference of 0.18%), Tlingit-Haida (6.0%, a difference of 0.25%), and Blackfeet (6.0%, a difference of 0.41%).
| Demographics | Rating | Rank | Male Unemployment |
| Nigerians | 0.0 /100 | #267 | Tragic 5.9% |
| Bermudans | 0.0 /100 | #268 | Tragic 5.9% |
| Immigrants | Nigeria | 0.0 /100 | #269 | Tragic 6.0% |
| Sub-Saharan Africans | 0.0 /100 | #270 | Tragic 6.0% |
| Blackfeet | 0.0 /100 | #271 | Tragic 6.0% |
| Immigrants | Uzbekistan | 0.0 /100 | #272 | Tragic 6.0% |
| Armenians | 0.0 /100 | #273 | Tragic 6.0% |
| Immigrants | Sierra Leone | 0.0 /100 | #274 | Tragic 6.0% |
| Menominee | 0.0 /100 | #275 | Tragic 6.0% |
| Tlingit-Haida | 0.0 /100 | #276 | Tragic 6.0% |
| Immigrants | Liberia | 0.0 /100 | #277 | Tragic 6.1% |
| Immigrants | Fiji | 0.0 /100 | #278 | Tragic 6.1% |
| Ghanaians | 0.0 /100 | #279 | Tragic 6.1% |
| Immigrants | Ghana | 0.0 /100 | #280 | Tragic 6.2% |
| Sierra Leoneans | 0.0 /100 | #281 | Tragic 6.2% |
Demographics Similar to Asians by Male Unemployment
In terms of male unemployment, the demographic groups most similar to Asians are Italian (5.1%, a difference of 0.030%), Immigrants from Spain (5.1%, a difference of 0.070%), Canadian (5.1%, a difference of 0.10%), Immigrants from Kuwait (5.1%, a difference of 0.11%), and Slavic (5.1%, a difference of 0.15%).
| Demographics | Rating | Rank | Male Unemployment |
| Immigrants | Australia | 94.7 /100 | #89 | Exceptional 5.1% |
| Okinawans | 94.7 /100 | #90 | Exceptional 5.1% |
| Immigrants | Turkey | 94.4 /100 | #91 | Exceptional 5.1% |
| Slavs | 94.2 /100 | #92 | Exceptional 5.1% |
| Immigrants | Serbia | 94.2 /100 | #93 | Exceptional 5.1% |
| Canadians | 94.1 /100 | #94 | Exceptional 5.1% |
| Italians | 93.8 /100 | #95 | Exceptional 5.1% |
| Asians | 93.7 /100 | #96 | Exceptional 5.1% |
| Immigrants | Spain | 93.4 /100 | #97 | Exceptional 5.1% |
| Immigrants | Kuwait | 93.3 /100 | #98 | Exceptional 5.1% |
| Uruguayans | 93.0 /100 | #99 | Exceptional 5.1% |
| Russians | 92.9 /100 | #100 | Exceptional 5.1% |
| German Russians | 92.7 /100 | #101 | Exceptional 5.1% |
| Immigrants | France | 92.7 /100 | #102 | Exceptional 5.1% |
| Immigrants | Jordan | 91.9 /100 | #103 | Exceptional 5.1% |