Immigrants from Serbia vs Central American Unemployment
COMPARE
Immigrants from Serbia
Central American
Unemployment
Unemployment Comparison
Immigrants from Serbia
Central Americans
5.0%
UNEMPLOYMENT
95.6/ 100
METRIC RATING
95th/ 347
METRIC RANK
5.7%
UNEMPLOYMENT
0.3/ 100
METRIC RATING
253rd/ 347
METRIC RANK
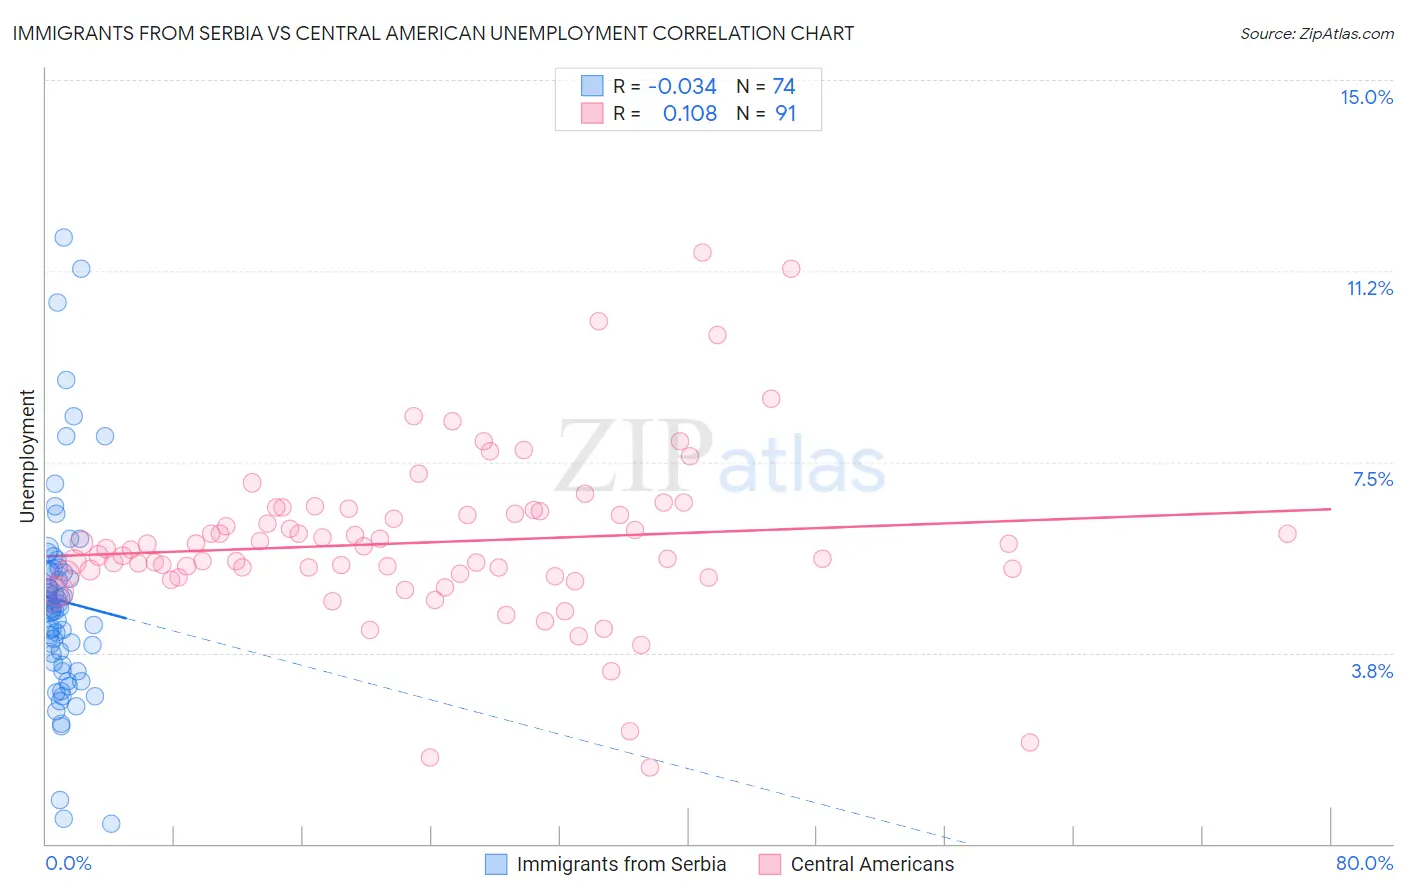
Immigrants from Serbia vs Central American Unemployment Correlation Chart
The statistical analysis conducted on geographies consisting of 131,730,582 people shows no correlation between the proportion of Immigrants from Serbia and unemployment in the United States with a correlation coefficient (R) of -0.034 and weighted average of 5.0%. Similarly, the statistical analysis conducted on geographies consisting of 503,567,641 people shows a poor positive correlation between the proportion of Central Americans and unemployment in the United States with a correlation coefficient (R) of 0.108 and weighted average of 5.7%, a difference of 14.2%.
Unemployment Correlation Summary
| Measurement | Immigrants from Serbia | Central American |
| Minimum | 0.40% | 1.5% |
| Maximum | 11.9% | 11.6% |
| Range | 11.5% | 10.1% |
| Mean | 4.8% | 5.9% |
| Median | 4.6% | 5.8% |
| Interquartile 25% (IQ1) | 3.6% | 5.3% |
| Interquartile 75% (IQ3) | 5.4% | 6.5% |
| Interquartile Range (IQR) | 1.8% | 1.3% |
| Standard Deviation (Sample) | 2.1% | 1.7% |
| Standard Deviation (Population) | 2.1% | 1.7% |
Similar Demographics by Unemployment
Demographics Similar to Immigrants from Serbia by Unemployment
In terms of unemployment, the demographic groups most similar to Immigrants from Serbia are Immigrants from Austria (5.0%, a difference of 0.13%), Immigrants from England (5.0%, a difference of 0.16%), Ukrainian (5.0%, a difference of 0.17%), Immigrants from Czechoslovakia (5.0%, a difference of 0.19%), and Romanian (5.0%, a difference of 0.22%).
| Demographics | Rating | Rank | Unemployment |
| Immigrants | Korea | 96.6 /100 | #88 | Exceptional 5.0% |
| Jordanians | 96.4 /100 | #89 | Exceptional 5.0% |
| Immigrants | North Macedonia | 96.3 /100 | #90 | Exceptional 5.0% |
| Immigrants | Sudan | 96.3 /100 | #91 | Exceptional 5.0% |
| Immigrants | South Africa | 96.2 /100 | #92 | Exceptional 5.0% |
| Ukrainians | 96.0 /100 | #93 | Exceptional 5.0% |
| Immigrants | Austria | 95.9 /100 | #94 | Exceptional 5.0% |
| Immigrants | Serbia | 95.6 /100 | #95 | Exceptional 5.0% |
| Immigrants | England | 95.2 /100 | #96 | Exceptional 5.0% |
| Immigrants | Czechoslovakia | 95.1 /100 | #97 | Exceptional 5.0% |
| Romanians | 95.0 /100 | #98 | Exceptional 5.0% |
| Mongolians | 94.8 /100 | #99 | Exceptional 5.0% |
| Estonians | 94.6 /100 | #100 | Exceptional 5.0% |
| Americans | 94.3 /100 | #101 | Exceptional 5.0% |
| Immigrants | Argentina | 94.1 /100 | #102 | Exceptional 5.0% |
Demographics Similar to Central Americans by Unemployment
In terms of unemployment, the demographic groups most similar to Central Americans are Honduran (5.7%, a difference of 0.010%), Immigrants from Honduras (5.7%, a difference of 0.070%), Immigrants from Portugal (5.7%, a difference of 0.52%), Guatemalan (5.8%, a difference of 0.72%), and Kiowa (5.7%, a difference of 0.75%).
| Demographics | Rating | Rank | Unemployment |
| Bermudans | 1.1 /100 | #246 | Tragic 5.6% |
| Immigrants | Cameroon | 1.0 /100 | #247 | Tragic 5.6% |
| Liberians | 0.9 /100 | #248 | Tragic 5.6% |
| Cajuns | 0.8 /100 | #249 | Tragic 5.6% |
| Japanese | 0.8 /100 | #250 | Tragic 5.6% |
| Kiowa | 0.6 /100 | #251 | Tragic 5.7% |
| Hondurans | 0.3 /100 | #252 | Tragic 5.7% |
| Central Americans | 0.3 /100 | #253 | Tragic 5.7% |
| Immigrants | Honduras | 0.3 /100 | #254 | Tragic 5.7% |
| Immigrants | Portugal | 0.2 /100 | #255 | Tragic 5.7% |
| Guatemalans | 0.2 /100 | #256 | Tragic 5.8% |
| Yaqui | 0.2 /100 | #257 | Tragic 5.8% |
| Immigrants | Bahamas | 0.1 /100 | #258 | Tragic 5.8% |
| Sub-Saharan Africans | 0.1 /100 | #259 | Tragic 5.8% |
| Immigrants | Uzbekistan | 0.1 /100 | #260 | Tragic 5.8% |