Immigrants from Serbia vs Assyrian/Chaldean/Syriac Disability Age 65 to 74
COMPARE
Immigrants from Serbia
Assyrian/Chaldean/Syriac
Disability Age 65 to 74
Disability Age 65 to 74 Comparison
Immigrants from Serbia
Assyrians/Chaldeans/Syriacs
21.4%
DISABILITY AGE 65 TO 74
99.6/ 100
METRIC RATING
51st/ 347
METRIC RANK
23.4%
DISABILITY AGE 65 TO 74
45.3/ 100
METRIC RATING
181st/ 347
METRIC RANK
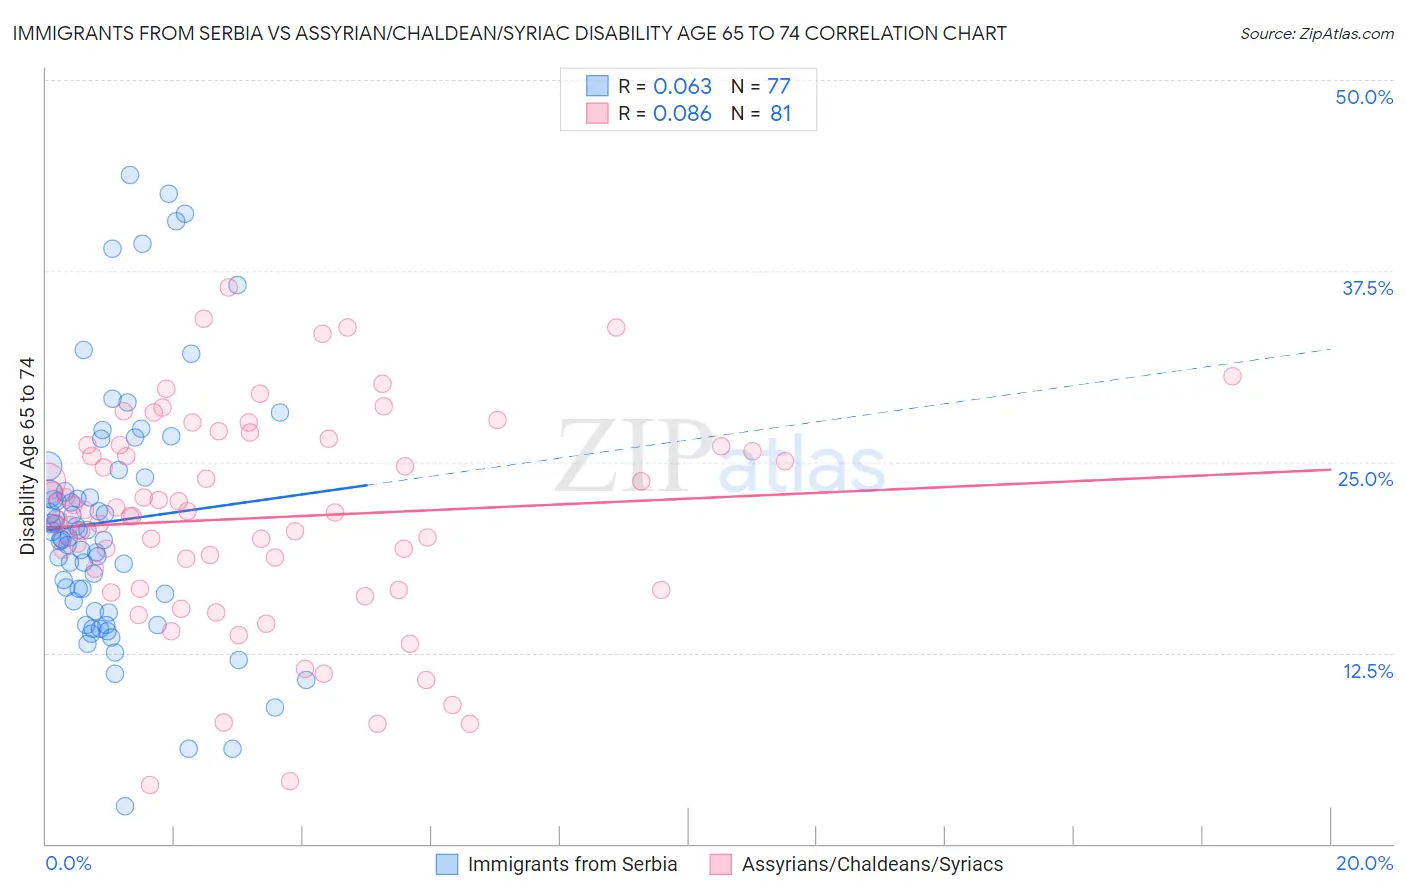
Immigrants from Serbia vs Assyrian/Chaldean/Syriac Disability Age 65 to 74 Correlation Chart
The statistical analysis conducted on geographies consisting of 131,669,066 people shows a slight positive correlation between the proportion of Immigrants from Serbia and percentage of population with a disability between the ages 65 and 75 in the United States with a correlation coefficient (R) of 0.063 and weighted average of 21.4%. Similarly, the statistical analysis conducted on geographies consisting of 110,230,384 people shows a slight positive correlation between the proportion of Assyrians/Chaldeans/Syriacs and percentage of population with a disability between the ages 65 and 75 in the United States with a correlation coefficient (R) of 0.086 and weighted average of 23.4%, a difference of 9.1%.
Disability Age 65 to 74 Correlation Summary
| Measurement | Immigrants from Serbia | Assyrian/Chaldean/Syriac |
| Minimum | 2.5% | 3.8% |
| Maximum | 43.7% | 36.4% |
| Range | 41.3% | 32.6% |
| Mean | 21.1% | 21.3% |
| Median | 20.0% | 21.7% |
| Interquartile 25% (IQ1) | 15.6% | 16.7% |
| Interquartile 75% (IQ3) | 24.2% | 26.1% |
| Interquartile Range (IQR) | 8.6% | 9.4% |
| Standard Deviation (Sample) | 8.4% | 7.0% |
| Standard Deviation (Population) | 8.3% | 6.9% |
Similar Demographics by Disability Age 65 to 74
Demographics Similar to Immigrants from Serbia by Disability Age 65 to 74
In terms of disability age 65 to 74, the demographic groups most similar to Immigrants from Serbia are Immigrants from Malaysia (21.4%, a difference of 0.22%), Immigrants from France (21.5%, a difference of 0.22%), Bhutanese (21.5%, a difference of 0.23%), Immigrants from Italy (21.5%, a difference of 0.24%), and Luxembourger (21.4%, a difference of 0.25%).
| Demographics | Rating | Rank | Disability Age 65 to 74 |
| Estonians | 99.7 /100 | #44 | Exceptional 21.4% |
| Asians | 99.7 /100 | #45 | Exceptional 21.4% |
| Immigrants | Turkey | 99.7 /100 | #46 | Exceptional 21.4% |
| Immigrants | Bulgaria | 99.7 /100 | #47 | Exceptional 21.4% |
| Lithuanians | 99.7 /100 | #48 | Exceptional 21.4% |
| Luxembourgers | 99.7 /100 | #49 | Exceptional 21.4% |
| Immigrants | Malaysia | 99.7 /100 | #50 | Exceptional 21.4% |
| Immigrants | Serbia | 99.6 /100 | #51 | Exceptional 21.4% |
| Immigrants | France | 99.6 /100 | #52 | Exceptional 21.5% |
| Bhutanese | 99.6 /100 | #53 | Exceptional 21.5% |
| Immigrants | Italy | 99.6 /100 | #54 | Exceptional 21.5% |
| Immigrants | Romania | 99.5 /100 | #55 | Exceptional 21.5% |
| Immigrants | Denmark | 99.5 /100 | #56 | Exceptional 21.5% |
| Immigrants | Asia | 99.5 /100 | #57 | Exceptional 21.5% |
| Immigrants | Pakistan | 99.5 /100 | #58 | Exceptional 21.5% |
Demographics Similar to Assyrians/Chaldeans/Syriacs by Disability Age 65 to 74
In terms of disability age 65 to 74, the demographic groups most similar to Assyrians/Chaldeans/Syriacs are Scandinavian (23.4%, a difference of 0.010%), Guyanese (23.4%, a difference of 0.030%), Immigrants from Sierra Leone (23.4%, a difference of 0.030%), Irish (23.4%, a difference of 0.060%), and Immigrants from Eritrea (23.4%, a difference of 0.13%).
| Demographics | Rating | Rank | Disability Age 65 to 74 |
| Immigrants | South Eastern Asia | 50.0 /100 | #174 | Average 23.3% |
| Dutch | 49.4 /100 | #175 | Average 23.3% |
| Immigrants | Eritrea | 47.5 /100 | #176 | Average 23.4% |
| Immigrants | Haiti | 47.5 /100 | #177 | Average 23.4% |
| Guyanese | 45.8 /100 | #178 | Average 23.4% |
| Immigrants | Sierra Leone | 45.8 /100 | #179 | Average 23.4% |
| Scandinavians | 45.6 /100 | #180 | Average 23.4% |
| Assyrians/Chaldeans/Syriacs | 45.3 /100 | #181 | Average 23.4% |
| Irish | 44.4 /100 | #182 | Average 23.4% |
| Immigrants | Eastern Africa | 42.8 /100 | #183 | Average 23.4% |
| Immigrants | Germany | 42.5 /100 | #184 | Average 23.4% |
| Haitians | 42.4 /100 | #185 | Average 23.4% |
| Basques | 38.4 /100 | #186 | Fair 23.5% |
| Portuguese | 37.8 /100 | #187 | Fair 23.5% |
| Immigrants | Cuba | 34.0 /100 | #188 | Fair 23.6% |