Immigrants from Senegal vs Immigrants from Eastern Asia Unemployment Among Women with Children Ages 6 to 17 years
COMPARE
Immigrants from Senegal
Immigrants from Eastern Asia
Unemployment Among Women with Children Ages 6 to 17 years
Unemployment Among Women with Children Ages 6 to 17 years Comparison
Immigrants from Senegal
Immigrants from Eastern Asia
10.2%
UNEMPLOYMENT AMONG WOMEN WITH CHILDREN AGES 6 TO 17 YEARS
0.0/ 100
METRIC RATING
307th/ 347
METRIC RANK
7.7%
UNEMPLOYMENT AMONG WOMEN WITH CHILDREN AGES 6 TO 17 YEARS
100.0/ 100
METRIC RATING
25th/ 347
METRIC RANK
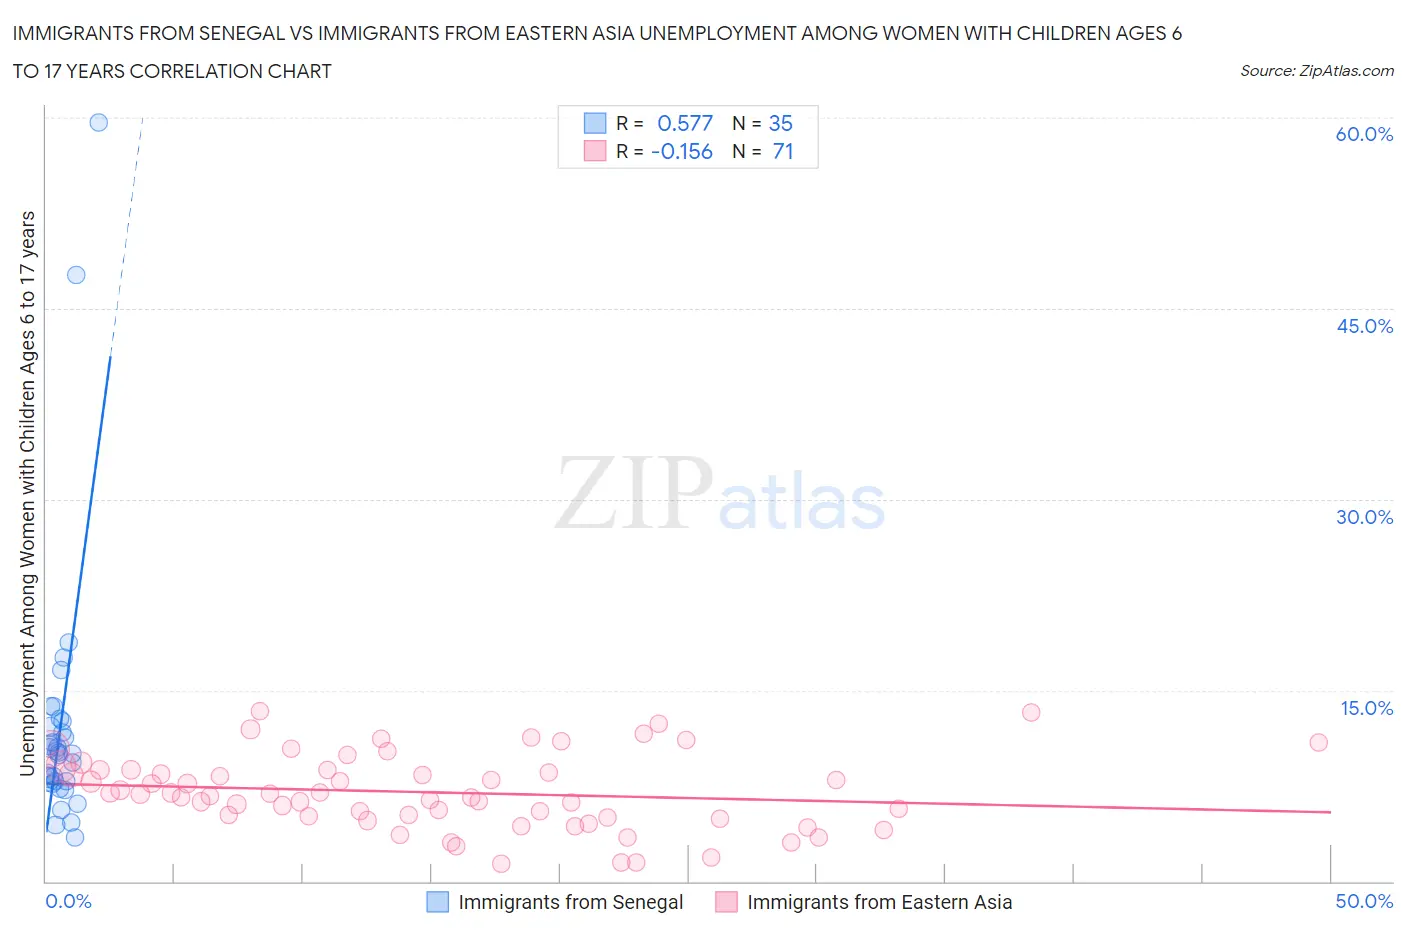
Immigrants from Senegal vs Immigrants from Eastern Asia Unemployment Among Women with Children Ages 6 to 17 years Correlation Chart
The statistical analysis conducted on geographies consisting of 80,966,607 people shows a substantial positive correlation between the proportion of Immigrants from Senegal and unemployment rate among women with children between the ages 6 and 17 in the United States with a correlation coefficient (R) of 0.577 and weighted average of 10.2%. Similarly, the statistical analysis conducted on geographies consisting of 336,493,390 people shows a poor negative correlation between the proportion of Immigrants from Eastern Asia and unemployment rate among women with children between the ages 6 and 17 in the United States with a correlation coefficient (R) of -0.156 and weighted average of 7.7%, a difference of 32.6%.
Unemployment Among Women with Children Ages 6 to 17 years Correlation Summary
| Measurement | Immigrants from Senegal | Immigrants from Eastern Asia |
| Minimum | 3.4% | 1.4% |
| Maximum | 59.6% | 13.3% |
| Range | 56.2% | 11.9% |
| Mean | 12.4% | 7.0% |
| Median | 10.1% | 6.8% |
| Interquartile 25% (IQ1) | 7.8% | 5.0% |
| Interquartile 75% (IQ3) | 12.5% | 8.7% |
| Interquartile Range (IQR) | 4.7% | 3.7% |
| Standard Deviation (Sample) | 11.0% | 2.9% |
| Standard Deviation (Population) | 10.8% | 2.9% |
Similar Demographics by Unemployment Among Women with Children Ages 6 to 17 years
Demographics Similar to Immigrants from Senegal by Unemployment Among Women with Children Ages 6 to 17 years
In terms of unemployment among women with children ages 6 to 17 years, the demographic groups most similar to Immigrants from Senegal are Dutch West Indian (10.2%, a difference of 0.010%), Paraguayan (10.2%, a difference of 0.23%), Immigrants from Nigeria (10.2%, a difference of 0.52%), French Canadian (10.3%, a difference of 0.55%), and Immigrants from Venezuela (10.2%, a difference of 0.57%).
| Demographics | Rating | Rank | Unemployment Among Women with Children Ages 6 to 17 years |
| Nigerians | 0.0 /100 | #300 | Tragic 10.1% |
| Immigrants | Bahamas | 0.0 /100 | #301 | Tragic 10.1% |
| Venezuelans | 0.0 /100 | #302 | Tragic 10.2% |
| Immigrants | Ecuador | 0.0 /100 | #303 | Tragic 10.2% |
| Immigrants | Venezuela | 0.0 /100 | #304 | Tragic 10.2% |
| Immigrants | Nigeria | 0.0 /100 | #305 | Tragic 10.2% |
| Paraguayans | 0.0 /100 | #306 | Tragic 10.2% |
| Immigrants | Senegal | 0.0 /100 | #307 | Tragic 10.2% |
| Dutch West Indians | 0.0 /100 | #308 | Tragic 10.2% |
| French Canadians | 0.0 /100 | #309 | Tragic 10.3% |
| Alaska Natives | 0.0 /100 | #310 | Tragic 10.3% |
| Immigrants | Liberia | 0.0 /100 | #311 | Tragic 10.3% |
| Africans | 0.0 /100 | #312 | Tragic 10.4% |
| Americans | 0.0 /100 | #313 | Tragic 10.4% |
| Immigrants | Cabo Verde | 0.0 /100 | #314 | Tragic 10.4% |
Demographics Similar to Immigrants from Eastern Asia by Unemployment Among Women with Children Ages 6 to 17 years
In terms of unemployment among women with children ages 6 to 17 years, the demographic groups most similar to Immigrants from Eastern Asia are Indian (Asian) (7.7%, a difference of 0.010%), Nepalese (7.7%, a difference of 0.12%), Immigrants from Indonesia (7.7%, a difference of 0.13%), Immigrants from China (7.7%, a difference of 0.51%), and Immigrants from Afghanistan (7.8%, a difference of 0.63%).
| Demographics | Rating | Rank | Unemployment Among Women with Children Ages 6 to 17 years |
| Afghans | 100.0 /100 | #18 | Exceptional 7.6% |
| Filipinos | 100.0 /100 | #19 | Exceptional 7.6% |
| Immigrants | Singapore | 100.0 /100 | #20 | Exceptional 7.7% |
| Immigrants | India | 100.0 /100 | #21 | Exceptional 7.7% |
| Immigrants | China | 100.0 /100 | #22 | Exceptional 7.7% |
| Immigrants | Indonesia | 100.0 /100 | #23 | Exceptional 7.7% |
| Nepalese | 100.0 /100 | #24 | Exceptional 7.7% |
| Immigrants | Eastern Asia | 100.0 /100 | #25 | Exceptional 7.7% |
| Indians (Asian) | 100.0 /100 | #26 | Exceptional 7.7% |
| Immigrants | Afghanistan | 100.0 /100 | #27 | Exceptional 7.8% |
| Immigrants | Uzbekistan | 100.0 /100 | #28 | Exceptional 7.8% |
| Thais | 100.0 /100 | #29 | Exceptional 7.8% |
| Immigrants | Iran | 100.0 /100 | #30 | Exceptional 7.9% |
| Laotians | 100.0 /100 | #31 | Exceptional 7.9% |
| Immigrants | Cambodia | 100.0 /100 | #32 | Exceptional 7.9% |