Immigrants from Senegal vs Immigrants from Cuba Unemployment Among Women with Children Ages 6 to 17 years
COMPARE
Immigrants from Senegal
Immigrants from Cuba
Unemployment Among Women with Children Ages 6 to 17 years
Unemployment Among Women with Children Ages 6 to 17 years Comparison
Immigrants from Senegal
Immigrants from Cuba
10.2%
UNEMPLOYMENT AMONG WOMEN WITH CHILDREN AGES 6 TO 17 YEARS
0.0/ 100
METRIC RATING
307th/ 347
METRIC RANK
9.2%
UNEMPLOYMENT AMONG WOMEN WITH CHILDREN AGES 6 TO 17 YEARS
9.6/ 100
METRIC RATING
211th/ 347
METRIC RANK
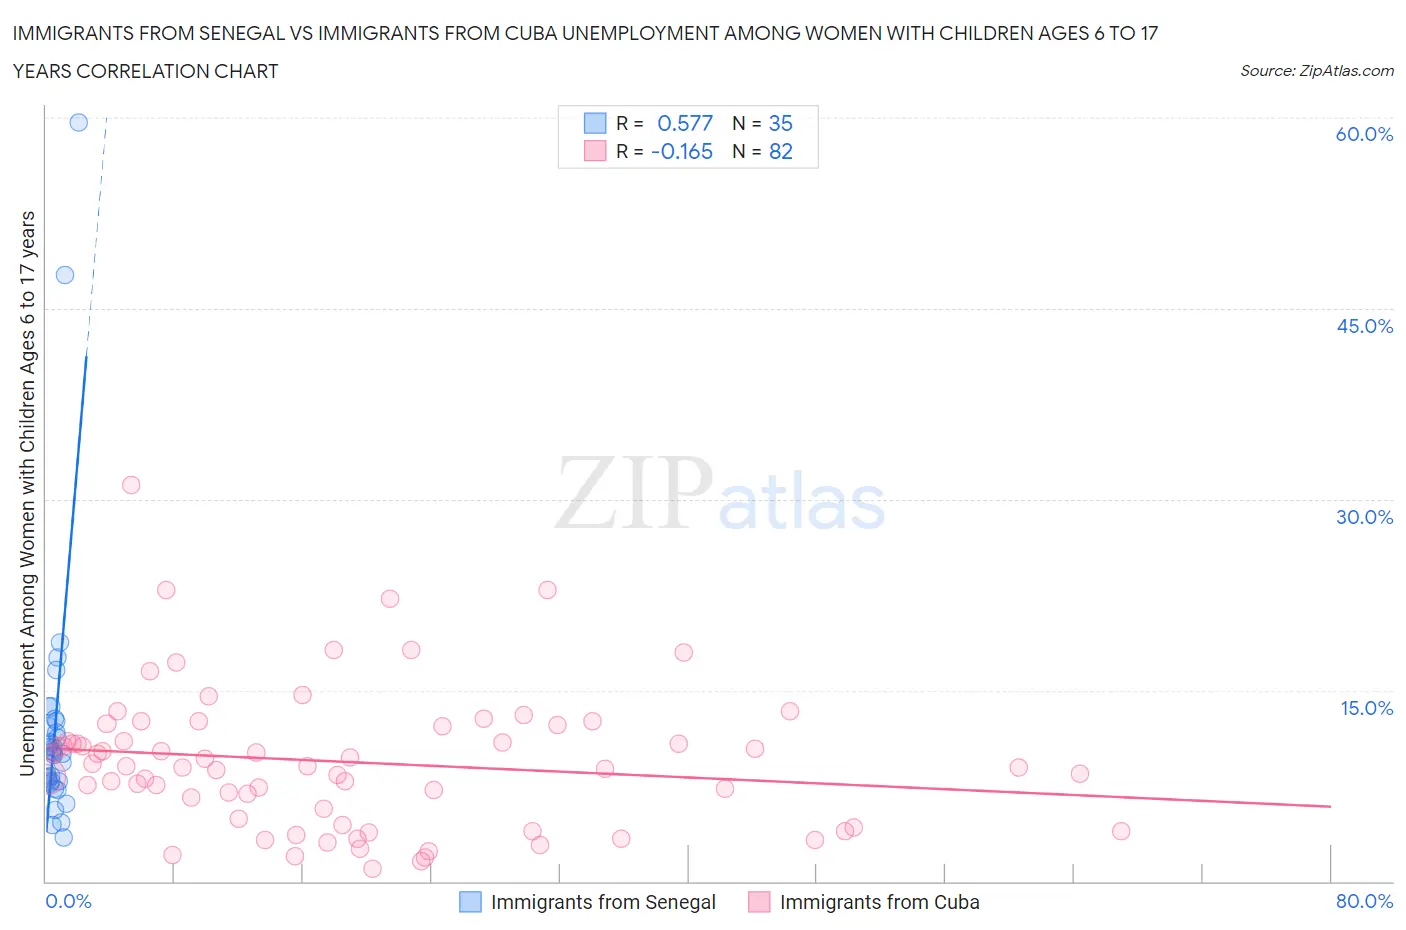
Immigrants from Senegal vs Immigrants from Cuba Unemployment Among Women with Children Ages 6 to 17 years Correlation Chart
The statistical analysis conducted on geographies consisting of 80,966,607 people shows a substantial positive correlation between the proportion of Immigrants from Senegal and unemployment rate among women with children between the ages 6 and 17 in the United States with a correlation coefficient (R) of 0.577 and weighted average of 10.2%. Similarly, the statistical analysis conducted on geographies consisting of 247,117,453 people shows a poor negative correlation between the proportion of Immigrants from Cuba and unemployment rate among women with children between the ages 6 and 17 in the United States with a correlation coefficient (R) of -0.165 and weighted average of 9.2%, a difference of 11.5%.
Unemployment Among Women with Children Ages 6 to 17 years Correlation Summary
| Measurement | Immigrants from Senegal | Immigrants from Cuba |
| Minimum | 3.4% | 1.0% |
| Maximum | 59.6% | 31.1% |
| Range | 56.2% | 30.1% |
| Mean | 12.4% | 9.4% |
| Median | 10.1% | 9.0% |
| Interquartile 25% (IQ1) | 7.8% | 5.0% |
| Interquartile 75% (IQ3) | 12.5% | 12.2% |
| Interquartile Range (IQR) | 4.7% | 7.2% |
| Standard Deviation (Sample) | 11.0% | 5.5% |
| Standard Deviation (Population) | 10.8% | 5.5% |
Similar Demographics by Unemployment Among Women with Children Ages 6 to 17 years
Demographics Similar to Immigrants from Senegal by Unemployment Among Women with Children Ages 6 to 17 years
In terms of unemployment among women with children ages 6 to 17 years, the demographic groups most similar to Immigrants from Senegal are Dutch West Indian (10.2%, a difference of 0.010%), Paraguayan (10.2%, a difference of 0.23%), Immigrants from Nigeria (10.2%, a difference of 0.52%), French Canadian (10.3%, a difference of 0.55%), and Immigrants from Venezuela (10.2%, a difference of 0.57%).
| Demographics | Rating | Rank | Unemployment Among Women with Children Ages 6 to 17 years |
| Nigerians | 0.0 /100 | #300 | Tragic 10.1% |
| Immigrants | Bahamas | 0.0 /100 | #301 | Tragic 10.1% |
| Venezuelans | 0.0 /100 | #302 | Tragic 10.2% |
| Immigrants | Ecuador | 0.0 /100 | #303 | Tragic 10.2% |
| Immigrants | Venezuela | 0.0 /100 | #304 | Tragic 10.2% |
| Immigrants | Nigeria | 0.0 /100 | #305 | Tragic 10.2% |
| Paraguayans | 0.0 /100 | #306 | Tragic 10.2% |
| Immigrants | Senegal | 0.0 /100 | #307 | Tragic 10.2% |
| Dutch West Indians | 0.0 /100 | #308 | Tragic 10.2% |
| French Canadians | 0.0 /100 | #309 | Tragic 10.3% |
| Alaska Natives | 0.0 /100 | #310 | Tragic 10.3% |
| Immigrants | Liberia | 0.0 /100 | #311 | Tragic 10.3% |
| Africans | 0.0 /100 | #312 | Tragic 10.4% |
| Americans | 0.0 /100 | #313 | Tragic 10.4% |
| Immigrants | Cabo Verde | 0.0 /100 | #314 | Tragic 10.4% |
Demographics Similar to Immigrants from Cuba by Unemployment Among Women with Children Ages 6 to 17 years
In terms of unemployment among women with children ages 6 to 17 years, the demographic groups most similar to Immigrants from Cuba are Finnish (9.2%, a difference of 0.050%), Peruvian (9.2%, a difference of 0.080%), Salvadoran (9.2%, a difference of 0.14%), Cuban (9.2%, a difference of 0.15%), and Immigrants from Peru (9.2%, a difference of 0.15%).
| Demographics | Rating | Rank | Unemployment Among Women with Children Ages 6 to 17 years |
| Immigrants | Canada | 15.3 /100 | #204 | Poor 9.1% |
| Immigrants | Western Europe | 14.1 /100 | #205 | Poor 9.1% |
| Immigrants | North America | 12.7 /100 | #206 | Poor 9.2% |
| Cubans | 10.9 /100 | #207 | Poor 9.2% |
| Immigrants | Peru | 10.8 /100 | #208 | Poor 9.2% |
| Salvadorans | 10.7 /100 | #209 | Poor 9.2% |
| Finns | 10.0 /100 | #210 | Tragic 9.2% |
| Immigrants | Cuba | 9.6 /100 | #211 | Tragic 9.2% |
| Peruvians | 9.0 /100 | #212 | Tragic 9.2% |
| Spaniards | 8.2 /100 | #213 | Tragic 9.2% |
| Iroquois | 7.5 /100 | #214 | Tragic 9.2% |
| Immigrants | Germany | 7.2 /100 | #215 | Tragic 9.2% |
| Immigrants | Uruguay | 7.2 /100 | #216 | Tragic 9.2% |
| Germans | 7.2 /100 | #217 | Tragic 9.2% |
| Syrians | 6.9 /100 | #218 | Tragic 9.2% |