Immigrants from Kenya vs Cheyenne Female Unemployment
COMPARE
Immigrants from Kenya
Cheyenne
Female Unemployment
Female Unemployment Comparison
Immigrants from Kenya
Cheyenne
5.0%
FEMALE UNEMPLOYMENT
94.8/ 100
METRIC RATING
102nd/ 347
METRIC RANK
6.6%
FEMALE UNEMPLOYMENT
0.0/ 100
METRIC RATING
324th/ 347
METRIC RANK
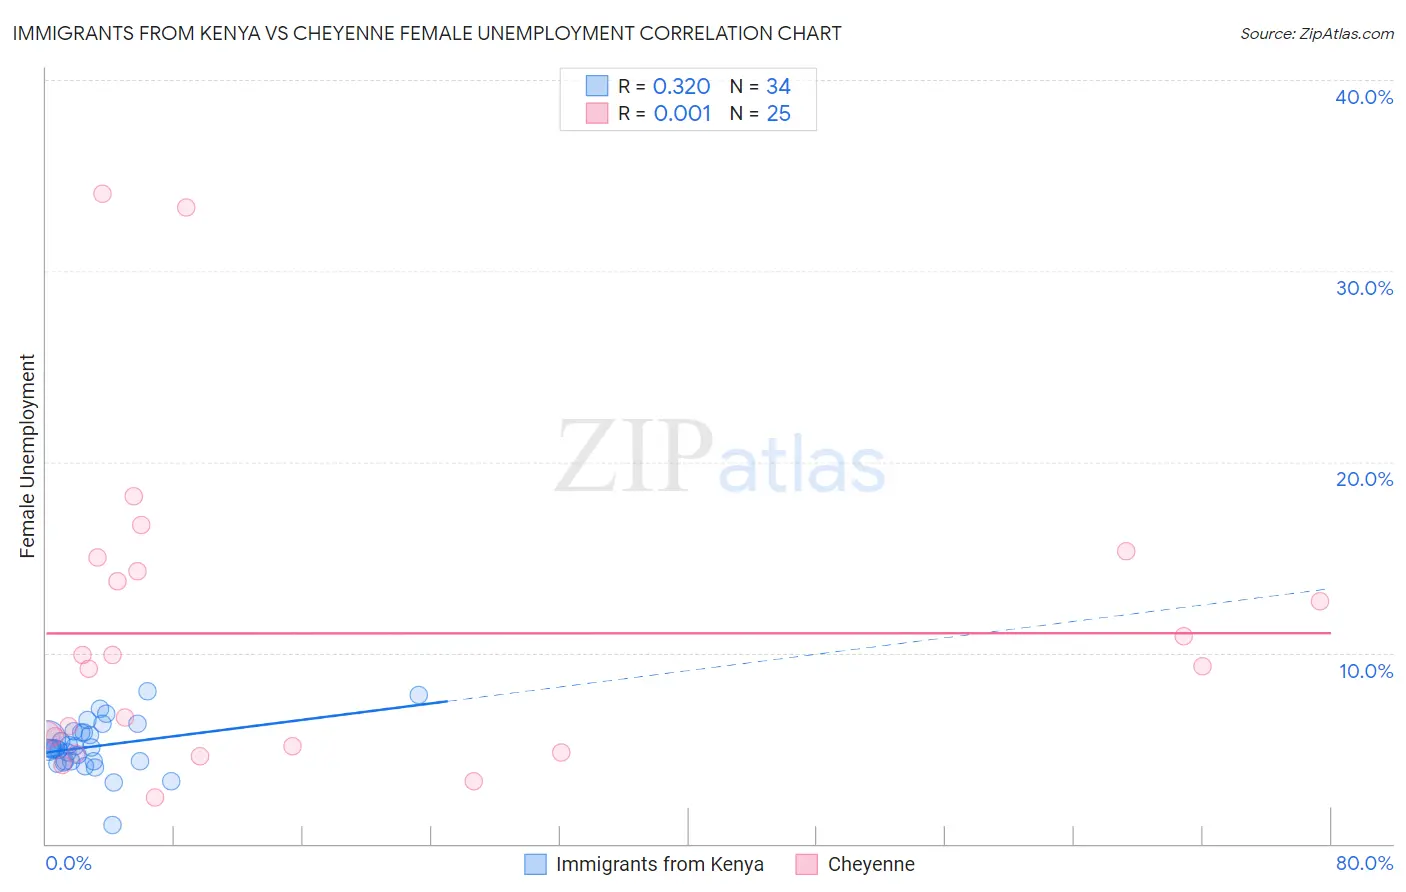
Immigrants from Kenya vs Cheyenne Female Unemployment Correlation Chart
The statistical analysis conducted on geographies consisting of 217,820,254 people shows a mild positive correlation between the proportion of Immigrants from Kenya and unemploymnet rate among females in the United States with a correlation coefficient (R) of 0.320 and weighted average of 5.0%. Similarly, the statistical analysis conducted on geographies consisting of 80,481,122 people shows no correlation between the proportion of Cheyenne and unemploymnet rate among females in the United States with a correlation coefficient (R) of 0.001 and weighted average of 6.6%, a difference of 30.7%.
Female Unemployment Correlation Summary
| Measurement | Immigrants from Kenya | Cheyenne |
| Minimum | 1.0% | 2.4% |
| Maximum | 8.0% | 34.0% |
| Range | 7.0% | 31.6% |
| Mean | 5.1% | 11.0% |
| Median | 5.0% | 9.3% |
| Interquartile 25% (IQ1) | 4.3% | 5.0% |
| Interquartile 75% (IQ3) | 5.8% | 14.6% |
| Interquartile Range (IQR) | 1.5% | 9.7% |
| Standard Deviation (Sample) | 1.3% | 8.2% |
| Standard Deviation (Population) | 1.3% | 8.0% |
Similar Demographics by Female Unemployment
Demographics Similar to Immigrants from Kenya by Female Unemployment
In terms of female unemployment, the demographic groups most similar to Immigrants from Kenya are Immigrants from Czechoslovakia (5.0%, a difference of 0.050%), Somali (5.0%, a difference of 0.080%), Indonesian (5.0%, a difference of 0.10%), Immigrants from Somalia (5.0%, a difference of 0.12%), and Immigrants from Kuwait (5.0%, a difference of 0.12%).
| Demographics | Rating | Rank | Female Unemployment |
| Burmese | 95.6 /100 | #95 | Exceptional 5.0% |
| Immigrants | South Central Asia | 95.5 /100 | #96 | Exceptional 5.0% |
| Immigrants | Somalia | 95.2 /100 | #97 | Exceptional 5.0% |
| Immigrants | Kuwait | 95.2 /100 | #98 | Exceptional 5.0% |
| Immigrants | Zaire | 95.2 /100 | #99 | Exceptional 5.0% |
| Indonesians | 95.1 /100 | #100 | Exceptional 5.0% |
| Immigrants | Czechoslovakia | 95.0 /100 | #101 | Exceptional 5.0% |
| Immigrants | Kenya | 94.8 /100 | #102 | Exceptional 5.0% |
| Somalis | 94.6 /100 | #103 | Exceptional 5.0% |
| Kenyans | 93.7 /100 | #104 | Exceptional 5.0% |
| Immigrants | England | 93.6 /100 | #105 | Exceptional 5.0% |
| Paraguayans | 93.2 /100 | #106 | Exceptional 5.1% |
| Immigrants | Switzerland | 93.1 /100 | #107 | Exceptional 5.1% |
| Puget Sound Salish | 93.0 /100 | #108 | Exceptional 5.1% |
| Immigrants | Eastern Africa | 92.8 /100 | #109 | Exceptional 5.1% |
Demographics Similar to Cheyenne by Female Unemployment
In terms of female unemployment, the demographic groups most similar to Cheyenne are Apache (6.6%, a difference of 0.27%), Native/Alaskan (6.6%, a difference of 0.83%), Alaska Native (6.6%, a difference of 0.91%), Immigrants from Belize (6.5%, a difference of 1.1%), and Vietnamese (6.5%, a difference of 1.2%).
| Demographics | Rating | Rank | Female Unemployment |
| Immigrants | St. Vincent and the Grenadines | 0.0 /100 | #317 | Tragic 6.4% |
| British West Indians | 0.0 /100 | #318 | Tragic 6.4% |
| Immigrants | Bangladesh | 0.0 /100 | #319 | Tragic 6.5% |
| Immigrants | Dominica | 0.0 /100 | #320 | Tragic 6.5% |
| Blacks/African Americans | 0.0 /100 | #321 | Tragic 6.5% |
| Vietnamese | 0.0 /100 | #322 | Tragic 6.5% |
| Immigrants | Belize | 0.0 /100 | #323 | Tragic 6.5% |
| Cheyenne | 0.0 /100 | #324 | Tragic 6.6% |
| Apache | 0.0 /100 | #325 | Tragic 6.6% |
| Natives/Alaskans | 0.0 /100 | #326 | Tragic 6.6% |
| Alaska Natives | 0.0 /100 | #327 | Tragic 6.6% |
| Guyanese | 0.0 /100 | #328 | Tragic 6.7% |
| Immigrants | Guyana | 0.0 /100 | #329 | Tragic 6.7% |
| Yakama | 0.0 /100 | #330 | Tragic 6.7% |
| Paiute | 0.0 /100 | #331 | Tragic 6.8% |