Spanish American Indian vs Cheyenne Female Unemployment
COMPARE
Spanish American Indian
Cheyenne
Female Unemployment
Female Unemployment Comparison
Spanish American Indians
Cheyenne
6.2%
FEMALE UNEMPLOYMENT
0.0/ 100
METRIC RATING
305th/ 347
METRIC RANK
6.6%
FEMALE UNEMPLOYMENT
0.0/ 100
METRIC RATING
324th/ 347
METRIC RANK
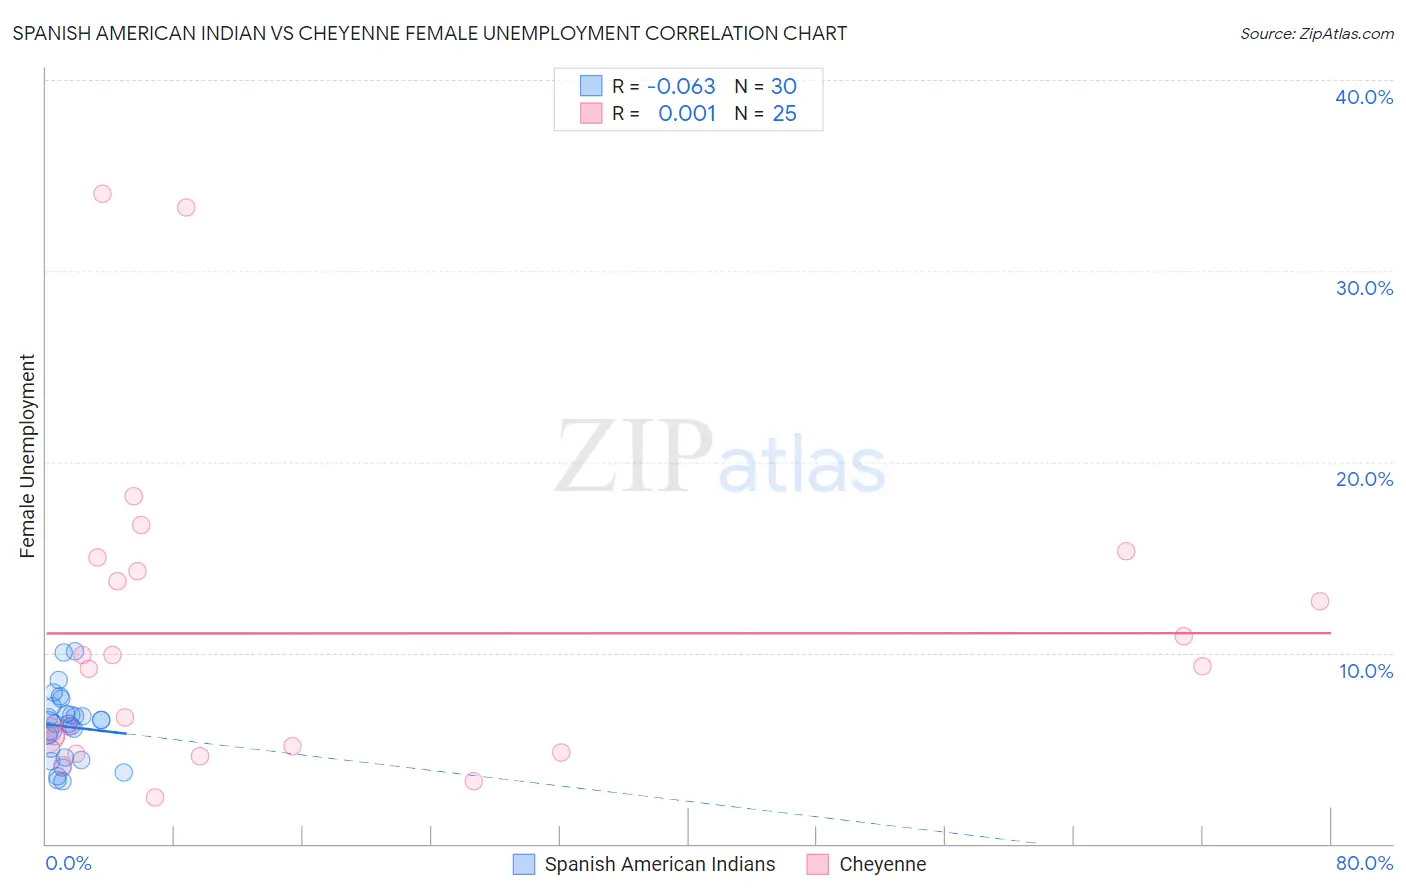
Spanish American Indian vs Cheyenne Female Unemployment Correlation Chart
The statistical analysis conducted on geographies consisting of 73,075,027 people shows a slight negative correlation between the proportion of Spanish American Indians and unemploymnet rate among females in the United States with a correlation coefficient (R) of -0.063 and weighted average of 6.2%. Similarly, the statistical analysis conducted on geographies consisting of 80,481,122 people shows no correlation between the proportion of Cheyenne and unemploymnet rate among females in the United States with a correlation coefficient (R) of 0.001 and weighted average of 6.6%, a difference of 5.7%.
Female Unemployment Correlation Summary
| Measurement | Spanish American Indian | Cheyenne |
| Minimum | 3.3% | 2.4% |
| Maximum | 10.1% | 34.0% |
| Range | 6.8% | 31.6% |
| Mean | 6.1% | 11.0% |
| Median | 6.3% | 9.3% |
| Interquartile 25% (IQ1) | 4.5% | 5.0% |
| Interquartile 75% (IQ3) | 6.8% | 14.6% |
| Interquartile Range (IQR) | 2.3% | 9.7% |
| Standard Deviation (Sample) | 1.8% | 8.2% |
| Standard Deviation (Population) | 1.7% | 8.0% |
Demographics Similar to Spanish American Indians and Cheyenne by Female Unemployment
In terms of female unemployment, the demographic groups most similar to Spanish American Indians are Immigrants from Jamaica (6.2%, a difference of 0.060%), Immigrants from Central America (6.2%, a difference of 0.16%), Shoshone (6.2%, a difference of 0.17%), Hispanic or Latino (6.2%, a difference of 0.23%), and Ecuadorian (6.3%, a difference of 0.82%). Similarly, the demographic groups most similar to Cheyenne are Immigrants from Belize (6.5%, a difference of 1.1%), Vietnamese (6.5%, a difference of 1.2%), Black/African American (6.5%, a difference of 1.3%), Immigrants from Dominica (6.5%, a difference of 1.8%), and Immigrants from Bangladesh (6.5%, a difference of 1.8%).
| Demographics | Rating | Rank | Female Unemployment |
| Immigrants | Jamaica | 0.0 /100 | #304 | Tragic 6.2% |
| Spanish American Indians | 0.0 /100 | #305 | Tragic 6.2% |
| Immigrants | Central America | 0.0 /100 | #306 | Tragic 6.2% |
| Shoshone | 0.0 /100 | #307 | Tragic 6.2% |
| Hispanics or Latinos | 0.0 /100 | #308 | Tragic 6.2% |
| Ecuadorians | 0.0 /100 | #309 | Tragic 6.3% |
| Central American Indians | 0.0 /100 | #310 | Tragic 6.3% |
| Immigrants | Mexico | 0.0 /100 | #311 | Tragic 6.3% |
| Immigrants | Grenada | 0.0 /100 | #312 | Tragic 6.3% |
| Belizeans | 0.0 /100 | #313 | Tragic 6.3% |
| Immigrants | Ecuador | 0.0 /100 | #314 | Tragic 6.4% |
| Pueblo | 0.0 /100 | #315 | Tragic 6.4% |
| Houma | 0.0 /100 | #316 | Tragic 6.4% |
| Immigrants | St. Vincent and the Grenadines | 0.0 /100 | #317 | Tragic 6.4% |
| British West Indians | 0.0 /100 | #318 | Tragic 6.4% |
| Immigrants | Bangladesh | 0.0 /100 | #319 | Tragic 6.5% |
| Immigrants | Dominica | 0.0 /100 | #320 | Tragic 6.5% |
| Blacks/African Americans | 0.0 /100 | #321 | Tragic 6.5% |
| Vietnamese | 0.0 /100 | #322 | Tragic 6.5% |
| Immigrants | Belize | 0.0 /100 | #323 | Tragic 6.5% |
| Cheyenne | 0.0 /100 | #324 | Tragic 6.6% |