Immigrants from Saudi Arabia vs Immigrants from Malaysia Unemployment
COMPARE
Immigrants from Saudi Arabia
Immigrants from Malaysia
Unemployment
Unemployment Comparison
Immigrants from Saudi Arabia
Immigrants from Malaysia
5.1%
UNEMPLOYMENT
85.6/ 100
METRIC RATING
137th/ 347
METRIC RANK
5.1%
UNEMPLOYMENT
91.0/ 100
METRIC RATING
117th/ 347
METRIC RANK
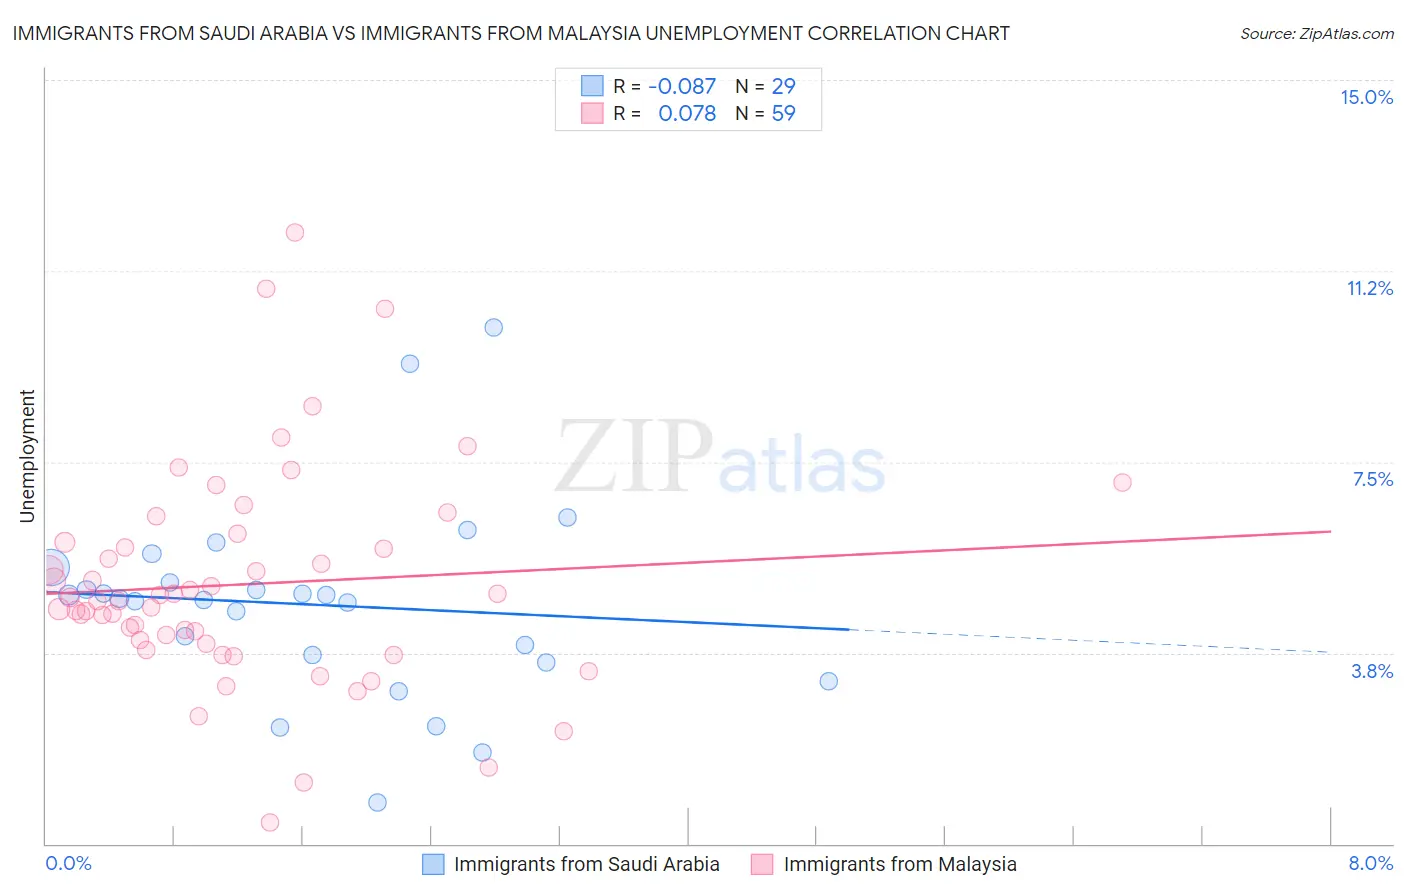
Immigrants from Saudi Arabia vs Immigrants from Malaysia Unemployment Correlation Chart
The statistical analysis conducted on geographies consisting of 164,272,517 people shows a slight negative correlation between the proportion of Immigrants from Saudi Arabia and unemployment in the United States with a correlation coefficient (R) of -0.087 and weighted average of 5.1%. Similarly, the statistical analysis conducted on geographies consisting of 197,947,224 people shows a slight positive correlation between the proportion of Immigrants from Malaysia and unemployment in the United States with a correlation coefficient (R) of 0.078 and weighted average of 5.1%, a difference of 0.84%.
Unemployment Correlation Summary
| Measurement | Immigrants from Saudi Arabia | Immigrants from Malaysia |
| Minimum | 0.80% | 0.41% |
| Maximum | 10.1% | 12.0% |
| Range | 9.3% | 11.6% |
| Mean | 4.7% | 5.1% |
| Median | 4.8% | 4.8% |
| Interquartile 25% (IQ1) | 3.6% | 3.9% |
| Interquartile 75% (IQ3) | 5.3% | 5.9% |
| Interquartile Range (IQR) | 1.6% | 2.0% |
| Standard Deviation (Sample) | 1.9% | 2.1% |
| Standard Deviation (Population) | 1.9% | 2.1% |
Demographics Similar to Immigrants from Saudi Arabia and Immigrants from Malaysia by Unemployment
In terms of unemployment, the demographic groups most similar to Immigrants from Saudi Arabia are Immigrants from Spain (5.1%, a difference of 0.070%), Immigrants from Burma/Myanmar (5.1%, a difference of 0.080%), Immigrants from Europe (5.1%, a difference of 0.090%), Immigrants from Jordan (5.1%, a difference of 0.13%), and Immigrants from Ethiopia (5.1%, a difference of 0.14%). Similarly, the demographic groups most similar to Immigrants from Malaysia are Immigrants from Germany (5.1%, a difference of 0.040%), Immigrants from France (5.1%, a difference of 0.24%), Macedonian (5.1%, a difference of 0.24%), Lebanese (5.1%, a difference of 0.32%), and Immigrants from Switzerland (5.1%, a difference of 0.33%).
| Demographics | Rating | Rank | Unemployment |
| Immigrants | Malaysia | 91.0 /100 | #117 | Exceptional 5.1% |
| Immigrants | Germany | 90.8 /100 | #118 | Exceptional 5.1% |
| Immigrants | France | 89.7 /100 | #119 | Excellent 5.1% |
| Macedonians | 89.7 /100 | #120 | Excellent 5.1% |
| Lebanese | 89.2 /100 | #121 | Excellent 5.1% |
| Immigrants | Switzerland | 89.1 /100 | #122 | Excellent 5.1% |
| Asians | 89.0 /100 | #123 | Excellent 5.1% |
| Ethiopians | 88.6 /100 | #124 | Excellent 5.1% |
| Immigrants | Eastern Asia | 88.3 /100 | #125 | Excellent 5.1% |
| Kenyans | 88.2 /100 | #126 | Excellent 5.1% |
| Immigrants | Kenya | 88.2 /100 | #127 | Excellent 5.1% |
| Immigrants | Eastern Africa | 88.1 /100 | #128 | Excellent 5.1% |
| Immigrants | Latvia | 88.0 /100 | #129 | Excellent 5.1% |
| Iranians | 86.9 /100 | #130 | Excellent 5.1% |
| Immigrants | Croatia | 86.8 /100 | #131 | Excellent 5.1% |
| Immigrants | Ethiopia | 86.7 /100 | #132 | Excellent 5.1% |
| Immigrants | Jordan | 86.6 /100 | #133 | Excellent 5.1% |
| Immigrants | Europe | 86.3 /100 | #134 | Excellent 5.1% |
| Immigrants | Burma/Myanmar | 86.2 /100 | #135 | Excellent 5.1% |
| Immigrants | Spain | 86.2 /100 | #136 | Excellent 5.1% |
| Immigrants | Saudi Arabia | 85.6 /100 | #137 | Excellent 5.1% |