Immigrants from Saudi Arabia vs Assyrian/Chaldean/Syriac Unemployment
COMPARE
Immigrants from Saudi Arabia
Assyrian/Chaldean/Syriac
Unemployment
Unemployment Comparison
Immigrants from Saudi Arabia
Assyrians/Chaldeans/Syriacs
5.1%
UNEMPLOYMENT
85.6/ 100
METRIC RATING
137th/ 347
METRIC RANK
5.3%
UNEMPLOYMENT
39.2/ 100
METRIC RATING
184th/ 347
METRIC RANK
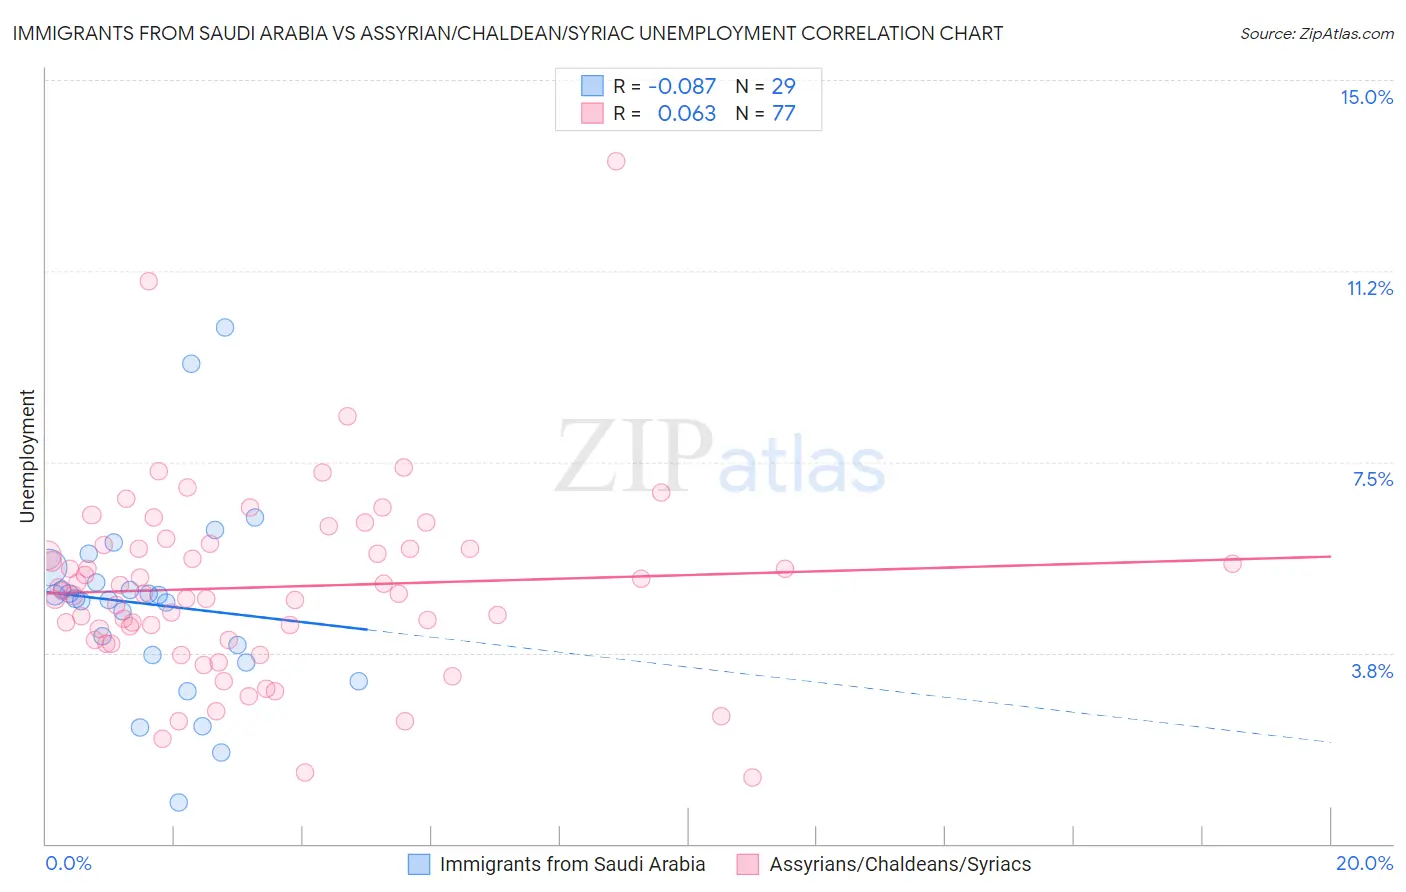
Immigrants from Saudi Arabia vs Assyrian/Chaldean/Syriac Unemployment Correlation Chart
The statistical analysis conducted on geographies consisting of 164,272,517 people shows a slight negative correlation between the proportion of Immigrants from Saudi Arabia and unemployment in the United States with a correlation coefficient (R) of -0.087 and weighted average of 5.1%. Similarly, the statistical analysis conducted on geographies consisting of 110,292,838 people shows a slight positive correlation between the proportion of Assyrians/Chaldeans/Syriacs and unemployment in the United States with a correlation coefficient (R) of 0.063 and weighted average of 5.3%, a difference of 3.5%.
Unemployment Correlation Summary
| Measurement | Immigrants from Saudi Arabia | Assyrian/Chaldean/Syriac |
| Minimum | 0.80% | 1.3% |
| Maximum | 10.1% | 13.4% |
| Range | 9.3% | 12.1% |
| Mean | 4.7% | 5.0% |
| Median | 4.8% | 4.9% |
| Interquartile 25% (IQ1) | 3.6% | 4.0% |
| Interquartile 75% (IQ3) | 5.3% | 5.8% |
| Interquartile Range (IQR) | 1.6% | 1.8% |
| Standard Deviation (Sample) | 1.9% | 1.9% |
| Standard Deviation (Population) | 1.9% | 1.8% |
Similar Demographics by Unemployment
Demographics Similar to Immigrants from Saudi Arabia by Unemployment
In terms of unemployment, the demographic groups most similar to Immigrants from Saudi Arabia are Immigrants from Hungary (5.1%, a difference of 0.010%), Pakistani (5.1%, a difference of 0.040%), Immigrants from Spain (5.1%, a difference of 0.070%), Immigrants from Burma/Myanmar (5.1%, a difference of 0.080%), and Immigrants from Europe (5.1%, a difference of 0.090%).
| Demographics | Rating | Rank | Unemployment |
| Iranians | 86.9 /100 | #130 | Excellent 5.1% |
| Immigrants | Croatia | 86.8 /100 | #131 | Excellent 5.1% |
| Immigrants | Ethiopia | 86.7 /100 | #132 | Excellent 5.1% |
| Immigrants | Jordan | 86.6 /100 | #133 | Excellent 5.1% |
| Immigrants | Europe | 86.3 /100 | #134 | Excellent 5.1% |
| Immigrants | Burma/Myanmar | 86.2 /100 | #135 | Excellent 5.1% |
| Immigrants | Spain | 86.2 /100 | #136 | Excellent 5.1% |
| Immigrants | Saudi Arabia | 85.6 /100 | #137 | Excellent 5.1% |
| Immigrants | Hungary | 85.6 /100 | #138 | Excellent 5.1% |
| Pakistanis | 85.3 /100 | #139 | Excellent 5.1% |
| Immigrants | Denmark | 84.3 /100 | #140 | Excellent 5.1% |
| Palestinians | 83.4 /100 | #141 | Excellent 5.1% |
| Immigrants | Pakistan | 83.2 /100 | #142 | Excellent 5.1% |
| Immigrants | Chile | 82.8 /100 | #143 | Excellent 5.1% |
| Indonesians | 82.3 /100 | #144 | Excellent 5.1% |
Demographics Similar to Assyrians/Chaldeans/Syriacs by Unemployment
In terms of unemployment, the demographic groups most similar to Assyrians/Chaldeans/Syriacs are Immigrants from Thailand (5.3%, a difference of 0.020%), Brazilian (5.3%, a difference of 0.060%), Immigrants from Uganda (5.3%, a difference of 0.090%), Costa Rican (5.3%, a difference of 0.12%), and Alsatian (5.3%, a difference of 0.14%).
| Demographics | Rating | Rank | Unemployment |
| Immigrants | Nonimmigrants | 47.9 /100 | #177 | Average 5.3% |
| Afghans | 47.4 /100 | #178 | Average 5.3% |
| Malaysians | 46.8 /100 | #179 | Average 5.3% |
| Immigrants | Greece | 45.0 /100 | #180 | Average 5.3% |
| Albanians | 43.5 /100 | #181 | Average 5.3% |
| Spaniards | 42.2 /100 | #182 | Average 5.3% |
| Brazilians | 40.2 /100 | #183 | Average 5.3% |
| Assyrians/Chaldeans/Syriacs | 39.2 /100 | #184 | Fair 5.3% |
| Immigrants | Thailand | 38.9 /100 | #185 | Fair 5.3% |
| Immigrants | Uganda | 37.8 /100 | #186 | Fair 5.3% |
| Costa Ricans | 37.4 /100 | #187 | Fair 5.3% |
| Alsatians | 37.0 /100 | #188 | Fair 5.3% |
| Immigrants | Belarus | 35.6 /100 | #189 | Fair 5.3% |
| Arabs | 35.3 /100 | #190 | Fair 5.3% |
| Somalis | 34.0 /100 | #191 | Fair 5.3% |