Immigrants from Saudi Arabia vs Alaskan Athabascan Single Mother Households
COMPARE
Immigrants from Saudi Arabia
Alaskan Athabascan
Single Mother Households
Single Mother Households Comparison
Immigrants from Saudi Arabia
Alaskan Athabascans
5.9%
SINGLE MOTHER HOUSEHOLDS
90.2/ 100
METRIC RATING
135th/ 347
METRIC RANK
7.3%
SINGLE MOTHER HOUSEHOLDS
0.3/ 100
METRIC RATING
252nd/ 347
METRIC RANK
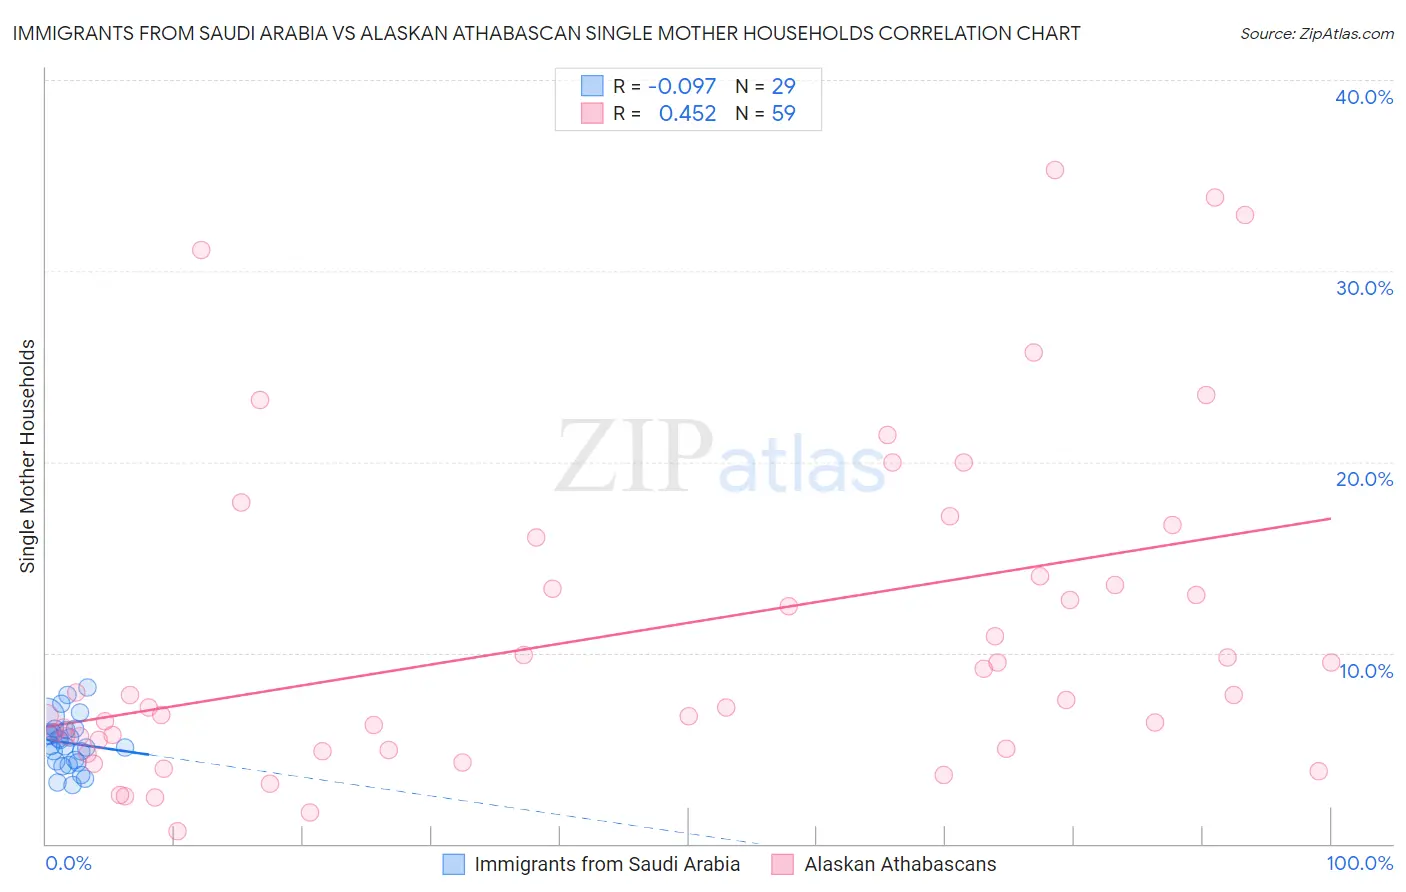
Immigrants from Saudi Arabia vs Alaskan Athabascan Single Mother Households Correlation Chart
The statistical analysis conducted on geographies consisting of 164,140,897 people shows a slight negative correlation between the proportion of Immigrants from Saudi Arabia and percentage of single mother households in the United States with a correlation coefficient (R) of -0.097 and weighted average of 5.9%. Similarly, the statistical analysis conducted on geographies consisting of 45,772,365 people shows a moderate positive correlation between the proportion of Alaskan Athabascans and percentage of single mother households in the United States with a correlation coefficient (R) of 0.452 and weighted average of 7.3%, a difference of 23.3%.
Single Mother Households Correlation Summary
| Measurement | Immigrants from Saudi Arabia | Alaskan Athabascan |
| Minimum | 3.1% | 0.67% |
| Maximum | 8.2% | 35.3% |
| Range | 5.1% | 34.6% |
| Mean | 5.3% | 10.9% |
| Median | 5.1% | 7.5% |
| Interquartile 25% (IQ1) | 4.3% | 5.0% |
| Interquartile 75% (IQ3) | 6.0% | 14.0% |
| Interquartile Range (IQR) | 1.7% | 9.0% |
| Standard Deviation (Sample) | 1.3% | 8.5% |
| Standard Deviation (Population) | 1.3% | 8.4% |
Similar Demographics by Single Mother Households
Demographics Similar to Immigrants from Saudi Arabia by Single Mother Households
In terms of single mother households, the demographic groups most similar to Immigrants from Saudi Arabia are Canadian (5.9%, a difference of 0.090%), Egyptian (5.9%, a difference of 0.15%), Albanian (5.9%, a difference of 0.31%), Immigrants from Spain (5.9%, a difference of 0.35%), and Jordanian (6.0%, a difference of 0.42%).
| Demographics | Rating | Rank | Single Mother Households |
| Czechoslovakians | 92.2 /100 | #128 | Exceptional 5.9% |
| Immigrants | Bolivia | 92.2 /100 | #129 | Exceptional 5.9% |
| Palestinians | 92.1 /100 | #130 | Exceptional 5.9% |
| Immigrants | Spain | 91.2 /100 | #131 | Exceptional 5.9% |
| Albanians | 91.1 /100 | #132 | Exceptional 5.9% |
| Egyptians | 90.7 /100 | #133 | Exceptional 5.9% |
| Canadians | 90.5 /100 | #134 | Exceptional 5.9% |
| Immigrants | Saudi Arabia | 90.2 /100 | #135 | Exceptional 5.9% |
| Jordanians | 88.9 /100 | #136 | Excellent 6.0% |
| Immigrants | Pakistan | 88.4 /100 | #137 | Excellent 6.0% |
| Icelanders | 86.9 /100 | #138 | Excellent 6.0% |
| Syrians | 86.0 /100 | #139 | Excellent 6.0% |
| French | 85.7 /100 | #140 | Excellent 6.0% |
| Tsimshian | 85.2 /100 | #141 | Excellent 6.0% |
| Immigrants | Egypt | 85.0 /100 | #142 | Excellent 6.0% |
Demographics Similar to Alaskan Athabascans by Single Mother Households
In terms of single mother households, the demographic groups most similar to Alaskan Athabascans are Malaysian (7.3%, a difference of 0.020%), Immigrants from Africa (7.3%, a difference of 0.37%), Bermudan (7.3%, a difference of 0.38%), Cajun (7.3%, a difference of 0.38%), and Immigrants from Ecuador (7.3%, a difference of 0.44%).
| Demographics | Rating | Rank | Single Mother Households |
| Immigrants | Cambodia | 0.5 /100 | #245 | Tragic 7.2% |
| Nicaraguans | 0.5 /100 | #246 | Tragic 7.2% |
| Dutch West Indians | 0.4 /100 | #247 | Tragic 7.3% |
| Spanish American Indians | 0.4 /100 | #248 | Tragic 7.3% |
| Bermudans | 0.4 /100 | #249 | Tragic 7.3% |
| Immigrants | Africa | 0.4 /100 | #250 | Tragic 7.3% |
| Malaysians | 0.3 /100 | #251 | Tragic 7.3% |
| Alaskan Athabascans | 0.3 /100 | #252 | Tragic 7.3% |
| Cajuns | 0.3 /100 | #253 | Tragic 7.3% |
| Immigrants | Ecuador | 0.3 /100 | #254 | Tragic 7.3% |
| Mexican American Indians | 0.2 /100 | #255 | Tragic 7.4% |
| Seminole | 0.2 /100 | #256 | Tragic 7.4% |
| Alaska Natives | 0.2 /100 | #257 | Tragic 7.4% |
| Pueblo | 0.2 /100 | #258 | Tragic 7.4% |
| Immigrants | Yemen | 0.2 /100 | #259 | Tragic 7.4% |