Immigrants from Moldova vs Alaskan Athabascan Female Unemployment
COMPARE
Immigrants from Moldova
Alaskan Athabascan
Female Unemployment
Female Unemployment Comparison
Immigrants from Moldova
Alaskan Athabascans
4.9%
FEMALE UNEMPLOYMENT
99.0/ 100
METRIC RATING
55th/ 347
METRIC RANK
6.1%
FEMALE UNEMPLOYMENT
0.0/ 100
METRIC RATING
296th/ 347
METRIC RANK
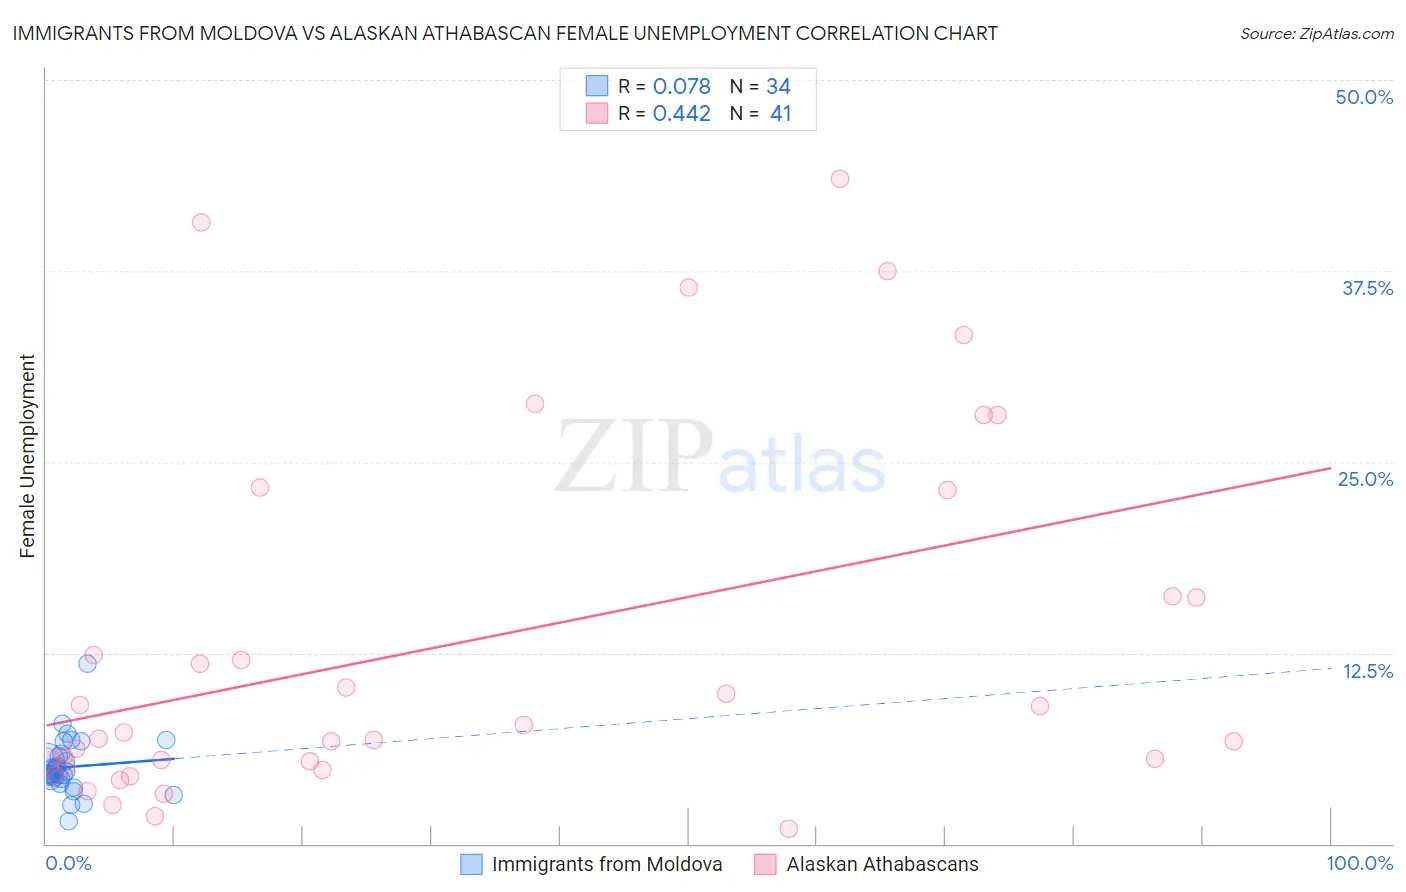
Immigrants from Moldova vs Alaskan Athabascan Female Unemployment Correlation Chart
The statistical analysis conducted on geographies consisting of 124,255,765 people shows a slight positive correlation between the proportion of Immigrants from Moldova and unemploymnet rate among females in the United States with a correlation coefficient (R) of 0.078 and weighted average of 4.9%. Similarly, the statistical analysis conducted on geographies consisting of 45,741,943 people shows a moderate positive correlation between the proportion of Alaskan Athabascans and unemploymnet rate among females in the United States with a correlation coefficient (R) of 0.442 and weighted average of 6.1%, a difference of 25.1%.
Female Unemployment Correlation Summary
| Measurement | Immigrants from Moldova | Alaskan Athabascan |
| Minimum | 1.5% | 1.0% |
| Maximum | 11.8% | 43.5% |
| Range | 10.3% | 42.5% |
| Mean | 5.0% | 13.2% |
| Median | 4.7% | 7.3% |
| Interquartile 25% (IQ1) | 4.2% | 5.2% |
| Interquartile 75% (IQ3) | 5.7% | 19.7% |
| Interquartile Range (IQR) | 1.5% | 14.4% |
| Standard Deviation (Sample) | 1.8% | 11.9% |
| Standard Deviation (Population) | 1.8% | 11.8% |
Similar Demographics by Female Unemployment
Demographics Similar to Immigrants from Moldova by Female Unemployment
In terms of female unemployment, the demographic groups most similar to Immigrants from Moldova are Immigrants from Zimbabwe (4.9%, a difference of 0.020%), Serbian (4.9%, a difference of 0.020%), White/Caucasian (4.9%, a difference of 0.080%), Slavic (4.9%, a difference of 0.10%), and Cambodian (4.9%, a difference of 0.12%).
| Demographics | Rating | Rank | Female Unemployment |
| Thais | 99.2 /100 | #48 | Exceptional 4.9% |
| Australians | 99.2 /100 | #49 | Exceptional 4.9% |
| Immigrants | Cuba | 99.1 /100 | #50 | Exceptional 4.9% |
| Cambodians | 99.1 /100 | #51 | Exceptional 4.9% |
| Slavs | 99.1 /100 | #52 | Exceptional 4.9% |
| Whites/Caucasians | 99.0 /100 | #53 | Exceptional 4.9% |
| Immigrants | Zimbabwe | 99.0 /100 | #54 | Exceptional 4.9% |
| Immigrants | Moldova | 99.0 /100 | #55 | Exceptional 4.9% |
| Serbians | 99.0 /100 | #56 | Exceptional 4.9% |
| Icelanders | 98.8 /100 | #57 | Exceptional 4.9% |
| Immigrants | Lithuania | 98.8 /100 | #58 | Exceptional 4.9% |
| Bhutanese | 98.7 /100 | #59 | Exceptional 4.9% |
| Immigrants | Scotland | 98.6 /100 | #60 | Exceptional 4.9% |
| Immigrants | Canada | 98.6 /100 | #61 | Exceptional 4.9% |
| Immigrants | Nepal | 98.6 /100 | #62 | Exceptional 4.9% |
Demographics Similar to Alaskan Athabascans by Female Unemployment
In terms of female unemployment, the demographic groups most similar to Alaskan Athabascans are West Indian (6.1%, a difference of 0.010%), Immigrants from Latin America (6.1%, a difference of 0.020%), Jamaican (6.1%, a difference of 0.030%), Immigrants from El Salvador (6.1%, a difference of 0.12%), and Ute (6.1%, a difference of 0.13%).
| Demographics | Rating | Rank | Female Unemployment |
| Trinidadians and Tobagonians | 0.0 /100 | #289 | Tragic 6.1% |
| Immigrants | Caribbean | 0.0 /100 | #290 | Tragic 6.1% |
| Immigrants | West Indies | 0.0 /100 | #291 | Tragic 6.1% |
| Immigrants | Trinidad and Tobago | 0.0 /100 | #292 | Tragic 6.1% |
| Mexicans | 0.0 /100 | #293 | Tragic 6.1% |
| Immigrants | El Salvador | 0.0 /100 | #294 | Tragic 6.1% |
| Immigrants | Latin America | 0.0 /100 | #295 | Tragic 6.1% |
| Alaskan Athabascans | 0.0 /100 | #296 | Tragic 6.1% |
| West Indians | 0.0 /100 | #297 | Tragic 6.1% |
| Jamaicans | 0.0 /100 | #298 | Tragic 6.1% |
| Ute | 0.0 /100 | #299 | Tragic 6.1% |
| Immigrants | Haiti | 0.0 /100 | #300 | Tragic 6.1% |
| Immigrants | Barbados | 0.0 /100 | #301 | Tragic 6.2% |
| U.S. Virgin Islanders | 0.0 /100 | #302 | Tragic 6.2% |
| Barbadians | 0.0 /100 | #303 | Tragic 6.2% |