Immigrants from Lebanon vs Spaniard Male Unemployment
COMPARE
Immigrants from Lebanon
Spaniard
Male Unemployment
Male Unemployment Comparison
Immigrants from Lebanon
Spaniards
5.5%
MALE UNEMPLOYMENT
8.6/ 100
METRIC RATING
208th/ 347
METRIC RANK
5.3%
MALE UNEMPLOYMENT
35.1/ 100
METRIC RATING
184th/ 347
METRIC RANK
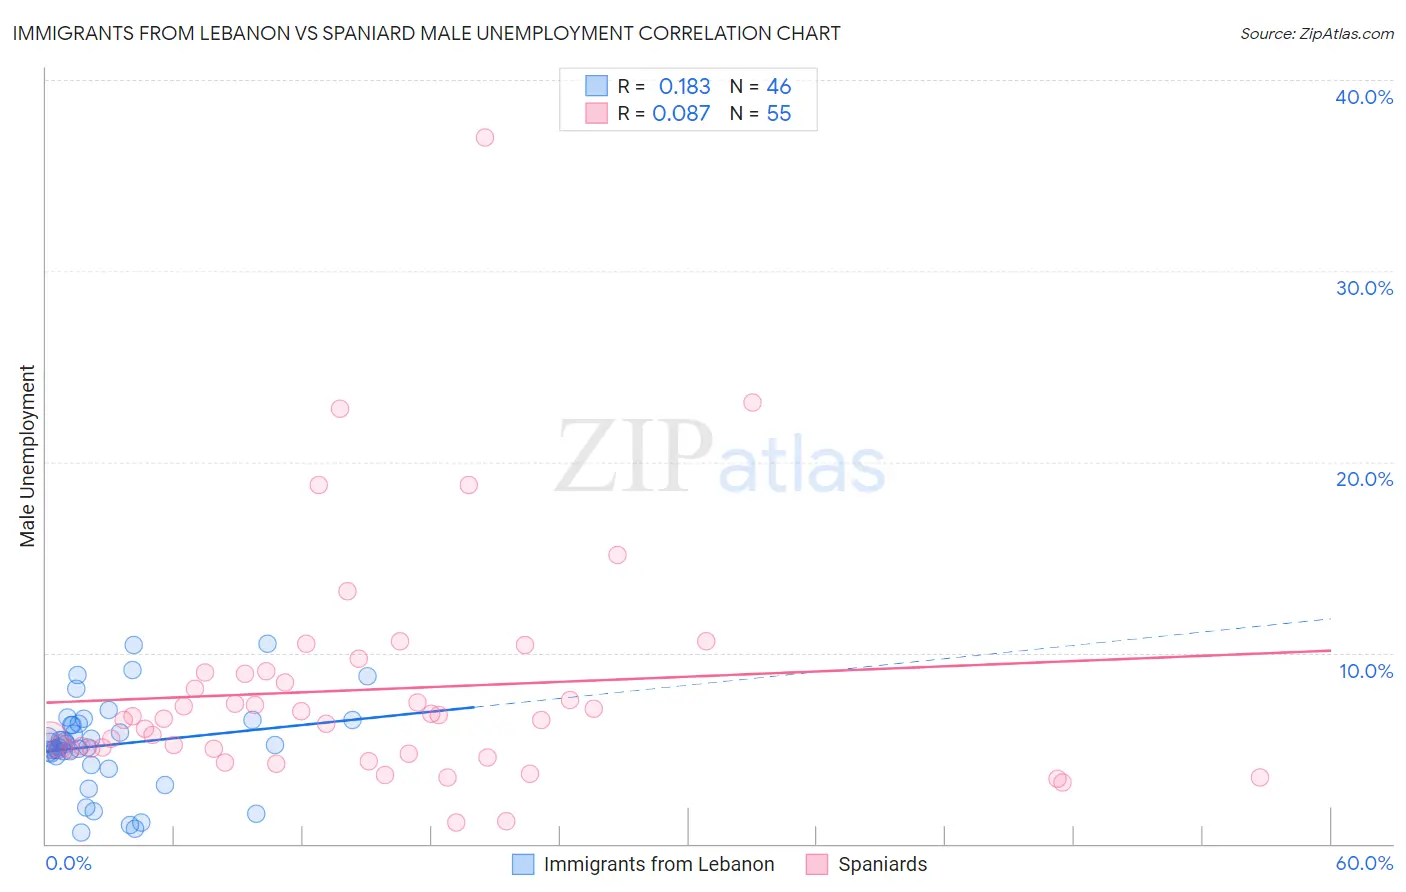
Immigrants from Lebanon vs Spaniard Male Unemployment Correlation Chart
The statistical analysis conducted on geographies consisting of 216,995,040 people shows a poor positive correlation between the proportion of Immigrants from Lebanon and unemployment rate among males in the United States with a correlation coefficient (R) of 0.183 and weighted average of 5.5%. Similarly, the statistical analysis conducted on geographies consisting of 441,055,878 people shows a slight positive correlation between the proportion of Spaniards and unemployment rate among males in the United States with a correlation coefficient (R) of 0.087 and weighted average of 5.3%, a difference of 2.5%.
Male Unemployment Correlation Summary
| Measurement | Immigrants from Lebanon | Spaniard |
| Minimum | 0.59% | 1.1% |
| Maximum | 10.5% | 37.0% |
| Range | 9.9% | 35.9% |
| Mean | 5.2% | 8.1% |
| Median | 5.2% | 6.6% |
| Interquartile 25% (IQ1) | 4.6% | 5.0% |
| Interquartile 75% (IQ3) | 6.3% | 8.9% |
| Interquartile Range (IQR) | 1.7% | 4.0% |
| Standard Deviation (Sample) | 2.3% | 6.1% |
| Standard Deviation (Population) | 2.3% | 6.0% |
Similar Demographics by Male Unemployment
Demographics Similar to Immigrants from Lebanon by Male Unemployment
In terms of male unemployment, the demographic groups most similar to Immigrants from Lebanon are Immigrants from Middle Africa (5.5%, a difference of 0.050%), Immigrants from Syria (5.5%, a difference of 0.13%), South American Indian (5.5%, a difference of 0.18%), Israeli (5.5%, a difference of 0.22%), and Immigrants from Ukraine (5.5%, a difference of 0.23%).
| Demographics | Rating | Rank | Male Unemployment |
| Immigrants | Philippines | 13.5 /100 | #201 | Poor 5.4% |
| Immigrants | Nonimmigrants | 13.1 /100 | #202 | Poor 5.4% |
| Immigrants | Laos | 13.0 /100 | #203 | Poor 5.4% |
| Guamanians/Chamorros | 12.3 /100 | #204 | Poor 5.4% |
| Immigrants | Costa Rica | 11.4 /100 | #205 | Poor 5.5% |
| Immigrants | Ukraine | 9.9 /100 | #206 | Tragic 5.5% |
| Immigrants | Syria | 9.3 /100 | #207 | Tragic 5.5% |
| Immigrants | Lebanon | 8.6 /100 | #208 | Tragic 5.5% |
| Immigrants | Middle Africa | 8.3 /100 | #209 | Tragic 5.5% |
| South American Indians | 7.6 /100 | #210 | Tragic 5.5% |
| Israelis | 7.4 /100 | #211 | Tragic 5.5% |
| Hmong | 7.0 /100 | #212 | Tragic 5.5% |
| Ugandans | 6.3 /100 | #213 | Tragic 5.5% |
| Puget Sound Salish | 5.6 /100 | #214 | Tragic 5.5% |
| Samoans | 4.9 /100 | #215 | Tragic 5.5% |
Demographics Similar to Spaniards by Male Unemployment
In terms of male unemployment, the demographic groups most similar to Spaniards are Korean (5.3%, a difference of 0.010%), Taiwanese (5.3%, a difference of 0.16%), Potawatomi (5.3%, a difference of 0.17%), Immigrants from Afghanistan (5.3%, a difference of 0.18%), and Iraqi (5.4%, a difference of 0.23%).
| Demographics | Rating | Rank | Male Unemployment |
| Immigrants | Peru | 44.6 /100 | #177 | Average 5.3% |
| Osage | 42.5 /100 | #178 | Average 5.3% |
| Immigrants | Oceania | 40.8 /100 | #179 | Average 5.3% |
| Malaysians | 39.6 /100 | #180 | Fair 5.3% |
| Immigrants | Afghanistan | 37.9 /100 | #181 | Fair 5.3% |
| Potawatomi | 37.8 /100 | #182 | Fair 5.3% |
| Taiwanese | 37.6 /100 | #183 | Fair 5.3% |
| Spaniards | 35.1 /100 | #184 | Fair 5.3% |
| Koreans | 34.9 /100 | #185 | Fair 5.3% |
| Iraqis | 31.6 /100 | #186 | Fair 5.4% |
| Costa Ricans | 31.3 /100 | #187 | Fair 5.4% |
| Arabs | 30.2 /100 | #188 | Fair 5.4% |
| Immigrants | South America | 29.4 /100 | #189 | Fair 5.4% |
| Immigrants | Uganda | 28.8 /100 | #190 | Fair 5.4% |
| Immigrants | South Eastern Asia | 28.2 /100 | #191 | Fair 5.4% |